# A tibble: 6 × 4
  country      year  cases population
  <chr>       <dbl>  <dbl>      <dbl>
1 Afghanistan  1999    745   19987071
2 Afghanistan  2000   2666   20595360
3 Brazil       1999  37737  172006362
4 Brazil       2000  80488  174504898
5 China        1999 212258 1272915272
6 China 2000 213766 1280428583MATH167R: Tidying and manipulating data
Peter Gao
Overview of today
- Tidying datasets
- Exploratory analysis
One dataset, four ways
# A tibble: 12 × 4
   country      year type            count
   <chr>       <dbl> <chr>           <dbl>
 1 Afghanistan  1999 cases             745
 2 Afghanistan  1999 population   19987071
 3 Afghanistan  2000 cases            2666
 4 Afghanistan  2000 population   20595360
 5 Brazil       1999 cases           37737
 6 Brazil       1999 population  172006362
 7 Brazil       2000 cases           80488
 8 Brazil       2000 population  174504898
 9 China        1999 cases          212258
10 China        1999 population 1272915272
11 China        2000 cases          213766
12 China 2000 population 1280428583# A tibble: 6 × 3
country year rate
<chr> <dbl> <chr>
1 Afghanistan 1999 745/19987071
2 Afghanistan 2000 2666/20595360
3 Brazil 1999 37737/172006362
4 Brazil 2000 80488/174504898
5 China 1999 212258/1272915272
6 China 2000 213766/1280428583# A tibble: 3 × 3
country `1999` `2000`
<chr> <dbl> <dbl>
1 Afghanistan 745 2666
2 Brazil 37737 80488
3 China 212258 213766Which way?
Suppose I wanted to create the following plot:
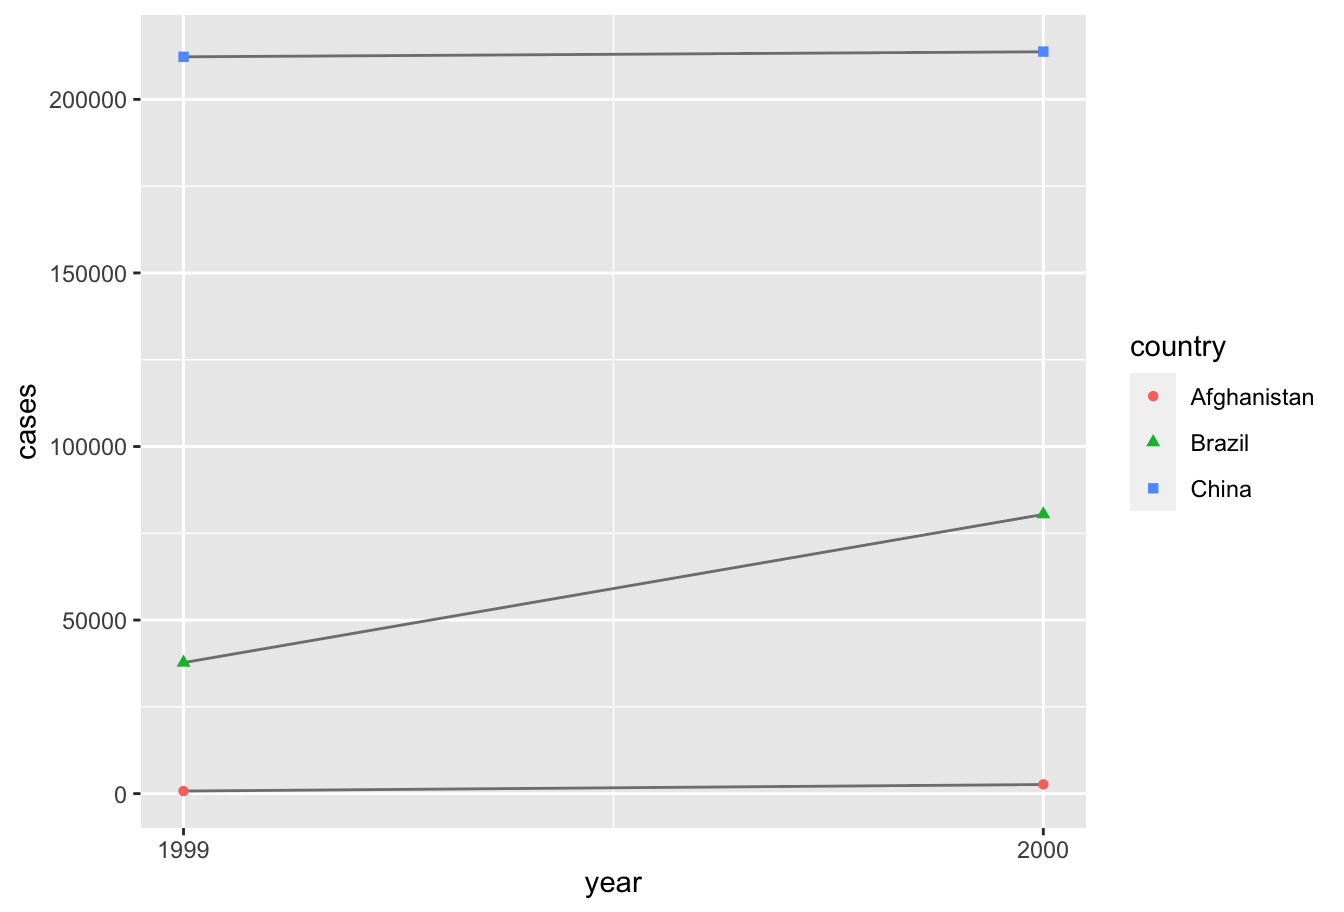
Which format should I use? Try to recreate this plot.
What if we wanted to compute the number of cases per capita, for each country and year?
Munging data
What if we want to convert from table2 or table4a and table4b to table1?
Today, we’ll discuss how to do this in both base R and the tidyverse.
pivot_longer() and pivot_wider()
The pivot_longer() and pivot_wider() functions are useful for reshaping data: pivot_longer() “lengthens” datasets and pivot_wider() does the opposite.
They are challenging to use because you need to have a clear vision of the data frame you want, not because they are complicated in R.
Example: pivot_longer()
| religion | <$10k | $10-20k | $20-30k | $30-40k | $40-50k | $50-75k | $75-100k | $100-150k | >150k | Don't know/refused |
|---|---|---|---|---|---|---|---|---|---|---|
| Agnostic | 27 | 34 | 60 | 81 | 76 | 137 | 122 | 109 | 84 | 96 |
| Atheist | 12 | 27 | 37 | 52 | 35 | 70 | 73 | 59 | 74 | 76 |
| Buddhist | 27 | 21 | 30 | 34 | 33 | 58 | 62 | 39 | 53 | 54 |
| Catholic | 418 | 617 | 732 | 670 | 638 | 1116 | 949 | 792 | 633 | 1489 |
| Don’t know/refused | 15 | 14 | 15 | 11 | 10 | 35 | 21 | 17 | 18 | 116 |
| Evangelical Prot | 575 | 869 | 1064 | 982 | 881 | 1486 | 949 | 723 | 414 | 1529 |
| Hindu | 1 | 9 | 7 | 9 | 11 | 34 | 47 | 48 | 54 | 37 |
| Historically Black Prot | 228 | 244 | 236 | 238 | 197 | 223 | 131 | 81 | 78 | 339 |
| Jehovah's Witness | 20 | 27 | 24 | 24 | 21 | 30 | 15 | 11 | 6 | 37 |
| Jewish | 19 | 19 | 25 | 25 | 30 | 95 | 69 | 87 | 151 | 162 |
| Mainline Prot | 289 | 495 | 619 | 655 | 651 | 1107 | 939 | 753 | 634 | 1328 |
| Mormon | 29 | 40 | 48 | 51 | 56 | 112 | 85 | 49 | 42 | 69 |
| Muslim | 6 | 7 | 9 | 10 | 9 | 23 | 16 | 8 | 6 | 22 |
| Orthodox | 13 | 17 | 23 | 32 | 32 | 47 | 38 | 42 | 46 | 73 |
| Other Christian | 9 | 7 | 11 | 13 | 13 | 14 | 18 | 14 | 12 | 18 |
| Other Faiths | 20 | 33 | 40 | 46 | 49 | 63 | 46 | 40 | 41 | 71 |
| Other World Religions | 5 | 2 | 3 | 4 | 2 | 7 | 3 | 4 | 4 | 8 |
| Unaffiliated | 217 | 299 | 374 | 365 | 341 | 528 | 407 | 321 | 258 | 597 |
Example: pivot_longer()
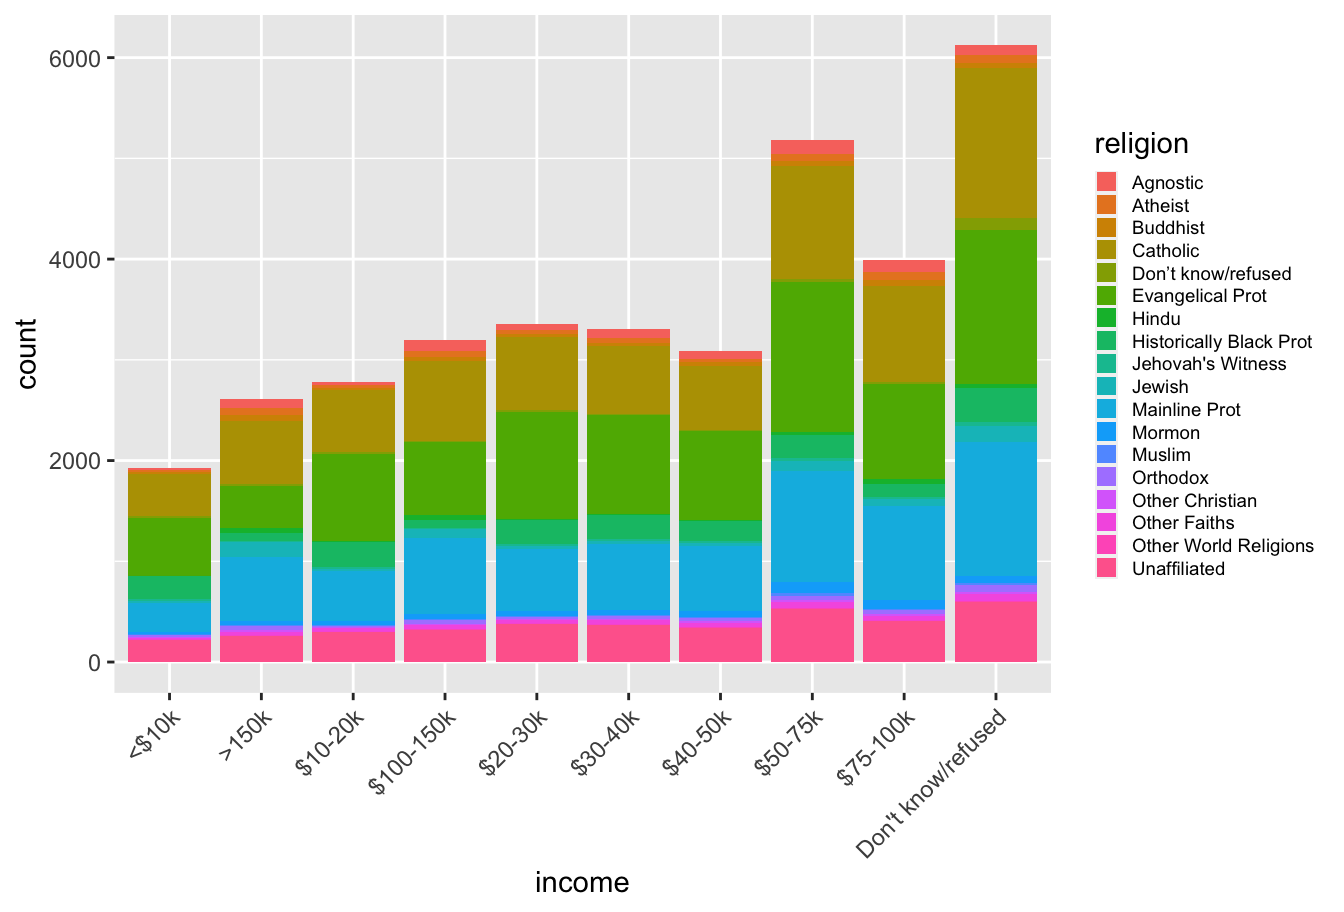
Example: pivot_longer()
| religion | income | count |
|---|---|---|
| Agnostic | <$10k | 27 |
| Agnostic | $10-20k | 34 |
| Agnostic | $20-30k | 60 |
| Agnostic | $30-40k | 81 |
| Agnostic | $40-50k | 76 |
| Agnostic | $50-75k | 137 |
| Agnostic | $75-100k | 122 |
| Agnostic | $100-150k | 109 |
| Agnostic | >150k | 84 |
| Agnostic | Don't know/refused | 96 |
| Atheist | <$10k | 12 |
| Atheist | $10-20k | 27 |
| Atheist | $20-30k | 37 |
| Atheist | $30-40k | 52 |
| Atheist | $40-50k | 35 |
| Atheist | $50-75k | 70 |
| Atheist | $75-100k | 73 |
| Atheist | $100-150k | 59 |
| Atheist | >150k | 74 |
| Atheist | Don't know/refused | 76 |
| Buddhist | <$10k | 27 |
| Buddhist | $10-20k | 21 |
| Buddhist | $20-30k | 30 |
| Buddhist | $30-40k | 34 |
| Buddhist | $40-50k | 33 |
| Buddhist | $50-75k | 58 |
| Buddhist | $75-100k | 62 |
| Buddhist | $100-150k | 39 |
| Buddhist | >150k | 53 |
| Buddhist | Don't know/refused | 54 |
| Catholic | <$10k | 418 |
| Catholic | $10-20k | 617 |
| Catholic | $20-30k | 732 |
| Catholic | $30-40k | 670 |
| Catholic | $40-50k | 638 |
| Catholic | $50-75k | 1116 |
| Catholic | $75-100k | 949 |
| Catholic | $100-150k | 792 |
| Catholic | >150k | 633 |
| Catholic | Don't know/refused | 1489 |
| Don’t know/refused | <$10k | 15 |
| Don’t know/refused | $10-20k | 14 |
| Don’t know/refused | $20-30k | 15 |
| Don’t know/refused | $30-40k | 11 |
| Don’t know/refused | $40-50k | 10 |
| Don’t know/refused | $50-75k | 35 |
| Don’t know/refused | $75-100k | 21 |
| Don’t know/refused | $100-150k | 17 |
| Don’t know/refused | >150k | 18 |
| Don’t know/refused | Don't know/refused | 116 |
| Evangelical Prot | <$10k | 575 |
| Evangelical Prot | $10-20k | 869 |
| Evangelical Prot | $20-30k | 1064 |
| Evangelical Prot | $30-40k | 982 |
| Evangelical Prot | $40-50k | 881 |
| Evangelical Prot | $50-75k | 1486 |
| Evangelical Prot | $75-100k | 949 |
| Evangelical Prot | $100-150k | 723 |
| Evangelical Prot | >150k | 414 |
| Evangelical Prot | Don't know/refused | 1529 |
| Hindu | <$10k | 1 |
| Hindu | $10-20k | 9 |
| Hindu | $20-30k | 7 |
| Hindu | $30-40k | 9 |
| Hindu | $40-50k | 11 |
| Hindu | $50-75k | 34 |
| Hindu | $75-100k | 47 |
| Hindu | $100-150k | 48 |
| Hindu | >150k | 54 |
| Hindu | Don't know/refused | 37 |
| Historically Black Prot | <$10k | 228 |
| Historically Black Prot | $10-20k | 244 |
| Historically Black Prot | $20-30k | 236 |
| Historically Black Prot | $30-40k | 238 |
| Historically Black Prot | $40-50k | 197 |
| Historically Black Prot | $50-75k | 223 |
| Historically Black Prot | $75-100k | 131 |
| Historically Black Prot | $100-150k | 81 |
| Historically Black Prot | >150k | 78 |
| Historically Black Prot | Don't know/refused | 339 |
| Jehovah's Witness | <$10k | 20 |
| Jehovah's Witness | $10-20k | 27 |
| Jehovah's Witness | $20-30k | 24 |
| Jehovah's Witness | $30-40k | 24 |
| Jehovah's Witness | $40-50k | 21 |
| Jehovah's Witness | $50-75k | 30 |
| Jehovah's Witness | $75-100k | 15 |
| Jehovah's Witness | $100-150k | 11 |
| Jehovah's Witness | >150k | 6 |
| Jehovah's Witness | Don't know/refused | 37 |
| Jewish | <$10k | 19 |
| Jewish | $10-20k | 19 |
| Jewish | $20-30k | 25 |
| Jewish | $30-40k | 25 |
| Jewish | $40-50k | 30 |
| Jewish | $50-75k | 95 |
| Jewish | $75-100k | 69 |
| Jewish | $100-150k | 87 |
| Jewish | >150k | 151 |
| Jewish | Don't know/refused | 162 |
| Mainline Prot | <$10k | 289 |
| Mainline Prot | $10-20k | 495 |
| Mainline Prot | $20-30k | 619 |
| Mainline Prot | $30-40k | 655 |
| Mainline Prot | $40-50k | 651 |
| Mainline Prot | $50-75k | 1107 |
| Mainline Prot | $75-100k | 939 |
| Mainline Prot | $100-150k | 753 |
| Mainline Prot | >150k | 634 |
| Mainline Prot | Don't know/refused | 1328 |
| Mormon | <$10k | 29 |
| Mormon | $10-20k | 40 |
| Mormon | $20-30k | 48 |
| Mormon | $30-40k | 51 |
| Mormon | $40-50k | 56 |
| Mormon | $50-75k | 112 |
| Mormon | $75-100k | 85 |
| Mormon | $100-150k | 49 |
| Mormon | >150k | 42 |
| Mormon | Don't know/refused | 69 |
| Muslim | <$10k | 6 |
| Muslim | $10-20k | 7 |
| Muslim | $20-30k | 9 |
| Muslim | $30-40k | 10 |
| Muslim | $40-50k | 9 |
| Muslim | $50-75k | 23 |
| Muslim | $75-100k | 16 |
| Muslim | $100-150k | 8 |
| Muslim | >150k | 6 |
| Muslim | Don't know/refused | 22 |
| Orthodox | <$10k | 13 |
| Orthodox | $10-20k | 17 |
| Orthodox | $20-30k | 23 |
| Orthodox | $30-40k | 32 |
| Orthodox | $40-50k | 32 |
| Orthodox | $50-75k | 47 |
| Orthodox | $75-100k | 38 |
| Orthodox | $100-150k | 42 |
| Orthodox | >150k | 46 |
| Orthodox | Don't know/refused | 73 |
| Other Christian | <$10k | 9 |
| Other Christian | $10-20k | 7 |
| Other Christian | $20-30k | 11 |
| Other Christian | $30-40k | 13 |
| Other Christian | $40-50k | 13 |
| Other Christian | $50-75k | 14 |
| Other Christian | $75-100k | 18 |
| Other Christian | $100-150k | 14 |
| Other Christian | >150k | 12 |
| Other Christian | Don't know/refused | 18 |
| Other Faiths | <$10k | 20 |
| Other Faiths | $10-20k | 33 |
| Other Faiths | $20-30k | 40 |
| Other Faiths | $30-40k | 46 |
| Other Faiths | $40-50k | 49 |
| Other Faiths | $50-75k | 63 |
| Other Faiths | $75-100k | 46 |
| Other Faiths | $100-150k | 40 |
| Other Faiths | >150k | 41 |
| Other Faiths | Don't know/refused | 71 |
| Other World Religions | <$10k | 5 |
| Other World Religions | $10-20k | 2 |
| Other World Religions | $20-30k | 3 |
| Other World Religions | $30-40k | 4 |
| Other World Religions | $40-50k | 2 |
| Other World Religions | $50-75k | 7 |
| Other World Religions | $75-100k | 3 |
| Other World Religions | $100-150k | 4 |
| Other World Religions | >150k | 4 |
| Other World Religions | Don't know/refused | 8 |
| Unaffiliated | <$10k | 217 |
| Unaffiliated | $10-20k | 299 |
| Unaffiliated | $20-30k | 374 |
| Unaffiliated | $30-40k | 365 |
| Unaffiliated | $40-50k | 341 |
| Unaffiliated | $50-75k | 528 |
| Unaffiliated | $75-100k | 407 |
| Unaffiliated | $100-150k | 321 |
| Unaffiliated | >150k | 258 |
| Unaffiliated | Don't know/refused | 597 |
Example: pivot_longer()
| artist | track | date.entered | wk1 | wk2 | wk3 | wk4 | wk5 | wk6 | wk7 | wk8 | wk9 | wk10 | wk11 | wk12 | wk13 | wk14 | wk15 | wk16 | wk17 | wk18 | wk19 | wk20 | wk21 | wk22 | wk23 | wk24 | wk25 | wk26 | wk27 | wk28 | wk29 | wk30 | wk31 | wk32 | wk33 | wk34 | wk35 | wk36 | wk37 | wk38 | wk39 | wk40 | wk41 | wk42 | wk43 | wk44 | wk45 | wk46 | wk47 | wk48 | wk49 | wk50 | wk51 | wk52 | wk53 | wk54 | wk55 | wk56 | wk57 | wk58 | wk59 | wk60 | wk61 | wk62 | wk63 | wk64 | wk65 | wk66 | wk67 | wk68 | wk69 | wk70 | wk71 | wk72 | wk73 | wk74 | wk75 | wk76 |
|---|---|---|---|---|---|---|---|---|---|---|---|---|---|---|---|---|---|---|---|---|---|---|---|---|---|---|---|---|---|---|---|---|---|---|---|---|---|---|---|---|---|---|---|---|---|---|---|---|---|---|---|---|---|---|---|---|---|---|---|---|---|---|---|---|---|---|---|---|---|---|---|---|---|---|---|---|---|---|
| 2 Pac | Baby Don't Cry (Keep... | 2000-02-26 | 87 | 82 | 72 | 77 | 87 | 94 | 99 | NA | NA | NA | NA | NA | NA | NA | NA | NA | NA | NA | NA | NA | NA | NA | NA | NA | NA | NA | NA | NA | NA | NA | NA | NA | NA | NA | NA | NA | NA | NA | NA | NA | NA | NA | NA | NA | NA | NA | NA | NA | NA | NA | NA | NA | NA | NA | NA | NA | NA | NA | NA | NA | NA | NA | NA | NA | NA | NA | NA | NA | NA | NA | NA | NA | NA | NA | NA | NA |
| 2Ge+her | The Hardest Part Of ... | 2000-09-02 | 91 | 87 | 92 | NA | NA | NA | NA | NA | NA | NA | NA | NA | NA | NA | NA | NA | NA | NA | NA | NA | NA | NA | NA | NA | NA | NA | NA | NA | NA | NA | NA | NA | NA | NA | NA | NA | NA | NA | NA | NA | NA | NA | NA | NA | NA | NA | NA | NA | NA | NA | NA | NA | NA | NA | NA | NA | NA | NA | NA | NA | NA | NA | NA | NA | NA | NA | NA | NA | NA | NA | NA | NA | NA | NA | NA | NA |
| 3 Doors Down | Kryptonite | 2000-04-08 | 81 | 70 | 68 | 67 | 66 | 57 | 54 | 53 | 51 | 51 | 51 | 51 | 47 | 44 | 38 | 28 | 22 | 18 | 18 | 14 | 12 | 7 | 6 | 6 | 6 | 5 | 5 | 4 | 4 | 4 | 4 | 3 | 3 | 3 | 4 | 5 | 5 | 9 | 9 | 15 | 14 | 13 | 14 | 16 | 17 | 21 | 22 | 24 | 28 | 33 | 42 | 42 | 49 | NA | NA | NA | NA | NA | NA | NA | NA | NA | NA | NA | NA | NA | NA | NA | NA | NA | NA | NA | NA | NA | NA | NA |
| 3 Doors Down | Loser | 2000-10-21 | 76 | 76 | 72 | 69 | 67 | 65 | 55 | 59 | 62 | 61 | 61 | 59 | 61 | 66 | 72 | 76 | 75 | 67 | 73 | 70 | NA | NA | NA | NA | NA | NA | NA | NA | NA | NA | NA | NA | NA | NA | NA | NA | NA | NA | NA | NA | NA | NA | NA | NA | NA | NA | NA | NA | NA | NA | NA | NA | NA | NA | NA | NA | NA | NA | NA | NA | NA | NA | NA | NA | NA | NA | NA | NA | NA | NA | NA | NA | NA | NA | NA | NA |
| 504 Boyz | Wobble Wobble | 2000-04-15 | 57 | 34 | 25 | 17 | 17 | 31 | 36 | 49 | 53 | 57 | 64 | 70 | 75 | 76 | 78 | 85 | 92 | 96 | NA | NA | NA | NA | NA | NA | NA | NA | NA | NA | NA | NA | NA | NA | NA | NA | NA | NA | NA | NA | NA | NA | NA | NA | NA | NA | NA | NA | NA | NA | NA | NA | NA | NA | NA | NA | NA | NA | NA | NA | NA | NA | NA | NA | NA | NA | NA | NA | NA | NA | NA | NA | NA | NA | NA | NA | NA | NA |
| 98^0 | Give Me Just One Nig... | 2000-08-19 | 51 | 39 | 34 | 26 | 26 | 19 | 2 | 2 | 3 | 6 | 7 | 22 | 29 | 36 | 47 | 67 | 66 | 84 | 93 | 94 | NA | NA | NA | NA | NA | NA | NA | NA | NA | NA | NA | NA | NA | NA | NA | NA | NA | NA | NA | NA | NA | NA | NA | NA | NA | NA | NA | NA | NA | NA | NA | NA | NA | NA | NA | NA | NA | NA | NA | NA | NA | NA | NA | NA | NA | NA | NA | NA | NA | NA | NA | NA | NA | NA | NA | NA |
Example: pivot_longer()
| artist | track | date.entered | week | rank |
|---|---|---|---|---|
| 2 Pac | Baby Don't Cry (Keep... | 2000-02-26 | 1 | 87 |
| 2 Pac | Baby Don't Cry (Keep... | 2000-02-26 | 2 | 82 |
| 2 Pac | Baby Don't Cry (Keep... | 2000-02-26 | 3 | 72 |
| 2 Pac | Baby Don't Cry (Keep... | 2000-02-26 | 4 | 77 |
| 2 Pac | Baby Don't Cry (Keep... | 2000-02-26 | 5 | 87 |
| 2 Pac | Baby Don't Cry (Keep... | 2000-02-26 | 6 | 94 |
| 2 Pac | Baby Don't Cry (Keep... | 2000-02-26 | 7 | 99 |
| 2Ge+her | The Hardest Part Of ... | 2000-09-02 | 1 | 91 |
| 2Ge+her | The Hardest Part Of ... | 2000-09-02 | 2 | 87 |
| 2Ge+her | The Hardest Part Of ... | 2000-09-02 | 3 | 92 |
| 3 Doors Down | Kryptonite | 2000-04-08 | 1 | 81 |
| 3 Doors Down | Kryptonite | 2000-04-08 | 2 | 70 |
| 3 Doors Down | Kryptonite | 2000-04-08 | 3 | 68 |
| 3 Doors Down | Kryptonite | 2000-04-08 | 4 | 67 |
| 3 Doors Down | Kryptonite | 2000-04-08 | 5 | 66 |
| 3 Doors Down | Kryptonite | 2000-04-08 | 6 | 57 |
| 3 Doors Down | Kryptonite | 2000-04-08 | 7 | 54 |
| 3 Doors Down | Kryptonite | 2000-04-08 | 8 | 53 |
| 3 Doors Down | Kryptonite | 2000-04-08 | 9 | 51 |
| 3 Doors Down | Kryptonite | 2000-04-08 | 10 | 51 |
Example: pivot_wider()
| fish | station | seen |
|---|---|---|
| 4842 | Release | 1 |
| 4842 | I80_1 | 1 |
| 4842 | Lisbon | 1 |
| 4842 | Rstr | 1 |
| 4842 | Base_TD | 1 |
| 4842 | BCE | 1 |
| 4842 | BCW | 1 |
| 4842 | BCE2 | 1 |
| 4842 | BCW2 | 1 |
| 4842 | MAE | 1 |
| 4842 | MAW | 1 |
| 4843 | Release | 1 |
| 4843 | I80_1 | 1 |
| 4843 | Lisbon | 1 |
| 4843 | Rstr | 1 |
| 4843 | Base_TD | 1 |
| 4843 | BCE | 1 |
| 4843 | BCW | 1 |
| 4843 | BCE2 | 1 |
| 4843 | BCW2 | 1 |
| 4843 | MAE | 1 |
| 4843 | MAW | 1 |
| 4844 | Release | 1 |
| 4844 | I80_1 | 1 |
| 4844 | Lisbon | 1 |
| 4844 | Rstr | 1 |
| 4844 | Base_TD | 1 |
| 4844 | BCE | 1 |
| 4844 | BCW | 1 |
| 4844 | BCE2 | 1 |
| 4844 | BCW2 | 1 |
| 4844 | MAE | 1 |
| 4844 | MAW | 1 |
| 4845 | Release | 1 |
| 4845 | I80_1 | 1 |
| 4845 | Lisbon | 1 |
| 4845 | Rstr | 1 |
| 4845 | Base_TD | 1 |
| 4847 | Release | 1 |
| 4847 | I80_1 | 1 |
| 4847 | Lisbon | 1 |
| 4848 | Release | 1 |
| 4848 | I80_1 | 1 |
| 4848 | Lisbon | 1 |
| 4848 | Rstr | 1 |
| 4849 | Release | 1 |
| 4849 | I80_1 | 1 |
| 4850 | Release | 1 |
| 4850 | I80_1 | 1 |
| 4850 | Rstr | 1 |
| 4850 | Base_TD | 1 |
| 4850 | BCE | 1 |
| 4850 | BCW | 1 |
| 4851 | Release | 1 |
| 4851 | I80_1 | 1 |
| 4854 | Release | 1 |
| 4854 | I80_1 | 1 |
| 4855 | Release | 1 |
| 4855 | I80_1 | 1 |
| 4855 | Lisbon | 1 |
| 4855 | Rstr | 1 |
| 4855 | Base_TD | 1 |
| 4857 | Release | 1 |
| 4857 | I80_1 | 1 |
| 4857 | Lisbon | 1 |
| 4857 | Rstr | 1 |
| 4857 | Base_TD | 1 |
| 4857 | BCE | 1 |
| 4857 | BCW | 1 |
| 4857 | BCE2 | 1 |
| 4857 | BCW2 | 1 |
| 4858 | Release | 1 |
| 4858 | I80_1 | 1 |
| 4858 | Lisbon | 1 |
| 4858 | Rstr | 1 |
| 4858 | Base_TD | 1 |
| 4858 | BCE | 1 |
| 4858 | BCW | 1 |
| 4858 | BCE2 | 1 |
| 4858 | BCW2 | 1 |
| 4858 | MAE | 1 |
| 4858 | MAW | 1 |
| 4859 | Release | 1 |
| 4859 | I80_1 | 1 |
| 4859 | Lisbon | 1 |
| 4859 | Rstr | 1 |
| 4859 | Base_TD | 1 |
| 4861 | Release | 1 |
| 4861 | I80_1 | 1 |
| 4861 | Lisbon | 1 |
| 4861 | Rstr | 1 |
| 4861 | Base_TD | 1 |
| 4861 | BCE | 1 |
| 4861 | BCW | 1 |
| 4861 | BCE2 | 1 |
| 4861 | BCW2 | 1 |
| 4861 | MAE | 1 |
| 4861 | MAW | 1 |
| 4862 | Release | 1 |
| 4862 | I80_1 | 1 |
| 4862 | Lisbon | 1 |
| 4862 | Rstr | 1 |
| 4862 | Base_TD | 1 |
| 4862 | BCE | 1 |
| 4862 | BCW | 1 |
| 4862 | BCE2 | 1 |
| 4862 | BCW2 | 1 |
| 4863 | Release | 1 |
| 4863 | I80_1 | 1 |
| 4864 | Release | 1 |
| 4864 | I80_1 | 1 |
| 4865 | Release | 1 |
| 4865 | I80_1 | 1 |
| 4865 | Lisbon | 1 |
Example: pivot_wider()
| fish | Release | I80_1 | Lisbon | Rstr | Base_TD | BCE | BCW | BCE2 | BCW2 | MAE | MAW |
|---|---|---|---|---|---|---|---|---|---|---|---|
| 4842 | 1 | 1 | 1 | 1 | 1 | 1 | 1 | 1 | 1 | 1 | 1 |
| 4843 | 1 | 1 | 1 | 1 | 1 | 1 | 1 | 1 | 1 | 1 | 1 |
| 4844 | 1 | 1 | 1 | 1 | 1 | 1 | 1 | 1 | 1 | 1 | 1 |
| 4845 | 1 | 1 | 1 | 1 | 1 | NA | NA | NA | NA | NA | NA |
| 4847 | 1 | 1 | 1 | NA | NA | NA | NA | NA | NA | NA | NA |
| 4848 | 1 | 1 | 1 | 1 | NA | NA | NA | NA | NA | NA | NA |
| 4849 | 1 | 1 | NA | NA | NA | NA | NA | NA | NA | NA | NA |
| 4850 | 1 | 1 | NA | 1 | 1 | 1 | 1 | NA | NA | NA | NA |
| 4851 | 1 | 1 | NA | NA | NA | NA | NA | NA | NA | NA | NA |
| 4854 | 1 | 1 | NA | NA | NA | NA | NA | NA | NA | NA | NA |
| 4855 | 1 | 1 | 1 | 1 | 1 | NA | NA | NA | NA | NA | NA |
| 4857 | 1 | 1 | 1 | 1 | 1 | 1 | 1 | 1 | 1 | NA | NA |
| 4858 | 1 | 1 | 1 | 1 | 1 | 1 | 1 | 1 | 1 | 1 | 1 |
| 4859 | 1 | 1 | 1 | 1 | 1 | NA | NA | NA | NA | NA | NA |
| 4861 | 1 | 1 | 1 | 1 | 1 | 1 | 1 | 1 | 1 | 1 | 1 |
| 4862 | 1 | 1 | 1 | 1 | 1 | 1 | 1 | 1 | 1 | NA | NA |
| 4863 | 1 | 1 | NA | NA | NA | NA | NA | NA | NA | NA | NA |
| 4864 | 1 | 1 | NA | NA | NA | NA | NA | NA | NA | NA | NA |
| 4865 | 1 | 1 | 1 | NA | NA | NA | NA | NA | NA | NA | NA |
Example: pivot_wider()
| GEOID | NAME | variable | estimate | moe |
|---|---|---|---|---|
| 01 | Alabama | income | 24476 | 136 |
| 01 | Alabama | rent | 747 | 3 |
| 02 | Alaska | income | 32940 | 508 |
| 02 | Alaska | rent | 1200 | 13 |
| 04 | Arizona | income | 27517 | 148 |
| 04 | Arizona | rent | 972 | 4 |
| 05 | Arkansas | income | 23789 | 165 |
| 05 | Arkansas | rent | 709 | 5 |
| 06 | California | income | 29454 | 109 |
| 06 | California | rent | 1358 | 3 |
| 08 | Colorado | income | 32401 | 109 |
| 08 | Colorado | rent | 1125 | 5 |
| 09 | Connecticut | income | 35326 | 195 |
| 09 | Connecticut | rent | 1123 | 5 |
| 10 | Delaware | income | 31560 | 247 |
| 10 | Delaware | rent | 1076 | 10 |
| 11 | District of Columbia | income | 43198 | 681 |
| 11 | District of Columbia | rent | 1424 | 17 |
| 12 | Florida | income | 25952 | 70 |
| 12 | Florida | rent | 1077 | 3 |
| 13 | Georgia | income | 27024 | 106 |
| 13 | Georgia | rent | 927 | 3 |
| 15 | Hawaii | income | 32453 | 218 |
| 15 | Hawaii | rent | 1507 | 18 |
| 16 | Idaho | income | 25298 | 208 |
| 16 | Idaho | rent | 792 | 7 |
| 17 | Illinois | income | 30684 | 83 |
| 17 | Illinois | rent | 952 | 3 |
| 18 | Indiana | income | 27247 | 117 |
| 18 | Indiana | rent | 782 | 3 |
| 19 | Iowa | income | 30002 | 143 |
| 19 | Iowa | rent | 740 | 4 |
| 20 | Kansas | income | 29126 | 208 |
| 20 | Kansas | rent | 801 | 5 |
| 21 | Kentucky | income | 24702 | 159 |
| 21 | Kentucky | rent | 713 | 4 |
| 22 | Louisiana | income | 25086 | 155 |
| 22 | Louisiana | rent | 825 | 4 |
| 23 | Maine | income | 26841 | 187 |
| 23 | Maine | rent | 808 | 7 |
| 24 | Maryland | income | 37147 | 152 |
| 24 | Maryland | rent | 1311 | 5 |
| 25 | Massachusetts | income | 34498 | 199 |
| 25 | Massachusetts | rent | 1173 | 5 |
| 26 | Michigan | income | 26987 | 82 |
| 26 | Michigan | rent | 824 | 3 |
| 27 | Minnesota | income | 32734 | 189 |
| 27 | Minnesota | rent | 906 | 4 |
| 28 | Mississippi | income | 22766 | 194 |
| 28 | Mississippi | rent | 740 | 5 |
| 29 | Missouri | income | 26999 | 113 |
| 29 | Missouri | rent | 784 | 4 |
| 30 | Montana | income | 26249 | 206 |
| 30 | Montana | rent | 751 | 9 |
| 31 | Nebraska | income | 30020 | 146 |
| 31 | Nebraska | rent | 773 | 4 |
| 32 | Nevada | income | 29019 | 213 |
| 32 | Nevada | rent | 1017 | 6 |
| 33 | New Hampshire | income | 33172 | 387 |
| 33 | New Hampshire | rent | 1052 | 9 |
| 34 | New Jersey | income | 35075 | 148 |
| 34 | New Jersey | rent | 1249 | 4 |
| 35 | New Mexico | income | 24457 | 214 |
| 35 | New Mexico | rent | 809 | 6 |
| 36 | New York | income | 31057 | 69 |
| 36 | New York | rent | 1194 | 3 |
| 37 | North Carolina | income | 26482 | 111 |
| 37 | North Carolina | rent | 844 | 3 |
| 38 | North Dakota | income | 32336 | 245 |
| 38 | North Dakota | rent | 775 | 9 |
| 39 | Ohio | income | 27435 | 94 |
| 39 | Ohio | rent | 764 | 2 |
| 40 | Oklahoma | income | 26207 | 101 |
| 40 | Oklahoma | rent | 766 | 3 |
| 41 | Oregon | income | 27389 | 146 |
| 41 | Oregon | rent | 988 | 4 |
| 42 | Pennsylvania | income | 28923 | 119 |
| 42 | Pennsylvania | rent | 885 | 3 |
| 44 | Rhode Island | income | 30210 | 259 |
| 44 | Rhode Island | rent | 957 | 6 |
| 45 | South Carolina | income | 25454 | 123 |
| 45 | South Carolina | rent | 836 | 4 |
| 46 | South Dakota | income | 28821 | 276 |
| 46 | South Dakota | rent | 696 | 7 |
| 47 | Tennessee | income | 25453 | 102 |
| 47 | Tennessee | rent | 808 | 4 |
| 48 | Texas | income | 28063 | 110 |
| 48 | Texas | rent | 952 | 2 |
| 49 | Utah | income | 27928 | 239 |
| 49 | Utah | rent | 948 | 6 |
| 50 | Vermont | income | 29351 | 361 |
| 50 | Vermont | rent | 945 | 11 |
| 51 | Virginia | income | 32545 | 202 |
| 51 | Virginia | rent | 1166 | 5 |
| 53 | Washington | income | 32318 | 113 |
| 53 | Washington | rent | 1120 | 4 |
| 54 | West Virginia | income | 23707 | 203 |
| 54 | West Virginia | rent | 681 | 6 |
| 55 | Wisconsin | income | 29868 | 135 |
| 55 | Wisconsin | rent | 813 | 3 |
| 56 | Wyoming | income | 30854 | 342 |
| 56 | Wyoming | rent | 828 | 11 |
| 72 | Puerto Rico | income | NA | NA |
| 72 | Puerto Rico | rent | 464 | 6 |
Example: pivot_wider()
| GEOID | NAME | estimate_income | estimate_rent | moe_income | moe_rent |
|---|---|---|---|---|---|
| 01 | Alabama | 24476 | 747 | 136 | 3 |
| 02 | Alaska | 32940 | 1200 | 508 | 13 |
| 04 | Arizona | 27517 | 972 | 148 | 4 |
| 05 | Arkansas | 23789 | 709 | 165 | 5 |
| 06 | California | 29454 | 1358 | 109 | 3 |
| 08 | Colorado | 32401 | 1125 | 109 | 5 |
| 09 | Connecticut | 35326 | 1123 | 195 | 5 |
| 10 | Delaware | 31560 | 1076 | 247 | 10 |
| 11 | District of Columbia | 43198 | 1424 | 681 | 17 |
| 12 | Florida | 25952 | 1077 | 70 | 3 |
| 13 | Georgia | 27024 | 927 | 106 | 3 |
| 15 | Hawaii | 32453 | 1507 | 218 | 18 |
| 16 | Idaho | 25298 | 792 | 208 | 7 |
| 17 | Illinois | 30684 | 952 | 83 | 3 |
| 18 | Indiana | 27247 | 782 | 117 | 3 |
| 19 | Iowa | 30002 | 740 | 143 | 4 |
| 20 | Kansas | 29126 | 801 | 208 | 5 |
| 21 | Kentucky | 24702 | 713 | 159 | 4 |
| 22 | Louisiana | 25086 | 825 | 155 | 4 |
| 23 | Maine | 26841 | 808 | 187 | 7 |
| 24 | Maryland | 37147 | 1311 | 152 | 5 |
| 25 | Massachusetts | 34498 | 1173 | 199 | 5 |
| 26 | Michigan | 26987 | 824 | 82 | 3 |
| 27 | Minnesota | 32734 | 906 | 189 | 4 |
| 28 | Mississippi | 22766 | 740 | 194 | 5 |
| 29 | Missouri | 26999 | 784 | 113 | 4 |
| 30 | Montana | 26249 | 751 | 206 | 9 |
| 31 | Nebraska | 30020 | 773 | 146 | 4 |
| 32 | Nevada | 29019 | 1017 | 213 | 6 |
| 33 | New Hampshire | 33172 | 1052 | 387 | 9 |
| 34 | New Jersey | 35075 | 1249 | 148 | 4 |
| 35 | New Mexico | 24457 | 809 | 214 | 6 |
| 36 | New York | 31057 | 1194 | 69 | 3 |
| 37 | North Carolina | 26482 | 844 | 111 | 3 |
| 38 | North Dakota | 32336 | 775 | 245 | 9 |
| 39 | Ohio | 27435 | 764 | 94 | 2 |
| 40 | Oklahoma | 26207 | 766 | 101 | 3 |
| 41 | Oregon | 27389 | 988 | 146 | 4 |
| 42 | Pennsylvania | 28923 | 885 | 119 | 3 |
| 44 | Rhode Island | 30210 | 957 | 259 | 6 |
| 45 | South Carolina | 25454 | 836 | 123 | 4 |
| 46 | South Dakota | 28821 | 696 | 276 | 7 |
| 47 | Tennessee | 25453 | 808 | 102 | 4 |
| 48 | Texas | 28063 | 952 | 110 | 2 |
| 49 | Utah | 27928 | 948 | 239 | 6 |
| 50 | Vermont | 29351 | 945 | 361 | 11 |
| 51 | Virginia | 32545 | 1166 | 202 | 5 |
| 53 | Washington | 32318 | 1120 | 113 | 4 |
| 54 | West Virginia | 23707 | 681 | 203 | 6 |
| 55 | Wisconsin | 29868 | 813 | 135 | 3 |
| 56 | Wyoming | 30854 | 828 | 342 | 11 |
| 72 | Puerto Rico | NA | 464 | NA | 6 |
One dataset, four ways
# A tibble: 6 × 4
  country      year  cases population
  <chr>       <dbl>  <dbl>      <dbl>
1 Afghanistan  1999    745   19987071
2 Afghanistan  2000   2666   20595360
3 Brazil       1999  37737  172006362
4 Brazil       2000  80488  174504898
5 China        1999 212258 1272915272
6 China 2000 213766 1280428583# A tibble: 12 × 4
country year type count
<chr> <dbl> <chr> <dbl>
1 Afghanistan 1999 cases 745
2 Afghanistan 1999 population 19987071
3 Afghanistan 2000 cases 2666
4 Afghanistan 2000 population 20595360
5 Brazil 1999 cases 37737
6 Brazil 1999 population 172006362
7 Brazil 2000 cases 80488
8 Brazil 2000 population 174504898
9 China 1999 cases 212258
10 China 1999 population 1272915272
11 China 2000 cases 213766
12 China 2000 population 1280428583# A tibble: 6 × 3
country year rate
<chr> <dbl> <chr>
1 Afghanistan 1999 745/19987071
2 Afghanistan 2000 2666/20595360
3 Brazil 1999 37737/172006362
4 Brazil 2000 80488/174504898
5 China 1999 212258/1272915272
6 China 2000 213766/1280428583# A tibble: 3 × 3
country `1999` `2000`
<chr> <dbl> <dbl>
1 Afghanistan 745 2666
2 Brazil 37737 80488
3 China 212258 213766Munging data
What if we want to convert from table2 or table4a and table4b to table1?
Group work: Work through how to convert table2 to table1 (and back). If time permits, try converting table4a and table4b table1 (and back).
Working with messier data: US population, 2010-2020
| SUMLEV | REGION | DIVISION | STATE | NAME | CENSUS2010POP | ESTIMATESBASE2010 | POPESTIMATE2010 | POPESTIMATE2011 | POPESTIMATE2012 | POPESTIMATE2013 | POPESTIMATE2014 | POPESTIMATE2015 | POPESTIMATE2016 | POPESTIMATE2017 | POPESTIMATE2018 | POPESTIMATE2019 | POPESTIMATE042020 | POPESTIMATE2020 |
|---|---|---|---|---|---|---|---|---|---|---|---|---|---|---|---|---|---|---|
| 010 | 0 | 0 | 00 | United States | 308745538 | 308758105 | 309327143 | 311583481 | 313877662 | 316059947 | 318386329 | 320738994 | 323071755 | 325122128 | 326838199 | 328329953 | 329398742 | 329484123 |
| 020 | 1 | 0 | 00 | Northeast Region | 55317240 | 55318414 | 55380764 | 55608318 | 55782661 | 55912775 | 56021339 | 56052790 | 56063777 | 56083383 | 56084543 | 56002934 | 55924275 | 55849869 |
| 020 | 2 | 0 | 00 | Midwest Region | 66927001 | 66929737 | 66975328 | 67164092 | 67348275 | 67576524 | 67765576 | 67885682 | 68018175 | 68160342 | 68263019 | 68340091 | 68357895 | 68316744 |
| 020 | 3 | 0 | 00 | South Region | 114555744 | 114563042 | 114869421 | 116019483 | 117264196 | 118397213 | 119666248 | 121049223 | 122419547 | 123611036 | 124649156 | 125686544 | 126494232 | 126662754 |
| 020 | 4 | 0 | 00 | West Region | 71945553 | 71946912 | 72101630 | 72791588 | 73482530 | 74173435 | 74933166 | 75751299 | 76570256 | 77267367 | 77841481 | 78300384 | 78622340 | 78654756 |
| 040 | 3 | 6 | 01 | Alabama | 4779736 | 4780118 | 4785514 | 4799642 | 4816632 | 4831586 | 4843737 | 4854803 | 4866824 | 4877989 | 4891628 | 4907965 | 4920706 | 4921532 |
| 040 | 4 | 9 | 02 | Alaska | 710231 | 710246 | 713982 | 722349 | 730810 | 737626 | 737075 | 738430 | 742575 | 740983 | 736624 | 733603 | 732074 | 731158 |
| 040 | 4 | 8 | 04 | Arizona | 6392017 | 6392292 | 6407342 | 6473416 | 6556344 | 6634690 | 6732873 | 6832810 | 6944767 | 7048088 | 7164228 | 7291843 | 7393900 | 7421401 |
| 040 | 3 | 7 | 05 | Arkansas | 2915918 | 2916029 | 2921998 | 2941038 | 2952876 | 2960459 | 2968759 | 2979732 | 2991815 | 3003855 | 3012161 | 3020985 | 3029672 | 3030522 |
| 040 | 4 | 9 | 06 | California | 37253956 | 37254522 | 37319550 | 37636311 | 37944551 | 38253768 | 38586706 | 38904296 | 39149186 | 39337785 | 39437463 | 39437610 | 39418894 | 39368078 |
| 040 | 4 | 8 | 08 | Colorado | 5029196 | 5029319 | 5047539 | 5121900 | 5193660 | 5270774 | 5352637 | 5454328 | 5543844 | 5617421 | 5697155 | 5758486 | 5798266 | 5807719 |
| 040 | 1 | 1 | 09 | Connecticut | 3574097 | 3574151 | 3579173 | 3588632 | 3595211 | 3595792 | 3595697 | 3588561 | 3579830 | 3575324 | 3574561 | 3566022 | 3561494 | 3557006 |
| 040 | 3 | 5 | 10 | Delaware | 897934 | 897947 | 899647 | 907590 | 915518 | 924062 | 933131 | 942065 | 949989 | 957942 | 966985 | 976668 | 984899 | 986809 |
| 040 | 3 | 5 | 11 | District of Columbia | 601723 | 601767 | 605282 | 620290 | 635737 | 651559 | 663603 | 677014 | 687576 | 697079 | 704147 | 708253 | 712185 | 712816 |
| 040 | 3 | 5 | 12 | Florida | 18801310 | 18804589 | 18846143 | 19055607 | 19302016 | 19551678 | 19853880 | 20219111 | 20627237 | 20977089 | 21254926 | 21492056 | 21688239 | 21733312 |
| 040 | 3 | 5 | 13 | Georgia | 9687653 | 9688737 | 9712209 | 9803630 | 9903580 | 9975592 | 10071204 | 10183353 | 10308442 | 10417031 | 10519389 | 10628020 | 10695662 | 10710017 |
| 040 | 4 | 9 | 15 | Hawaii | 1360301 | 1360304 | 1364004 | 1379562 | 1395199 | 1408822 | 1415335 | 1422999 | 1428885 | 1425763 | 1423102 | 1415615 | 1410587 | 1407006 |
| 040 | 4 | 8 | 16 | Idaho | 1567582 | 1567658 | 1570819 | 1584272 | 1595910 | 1612053 | 1632248 | 1652495 | 1684036 | 1719745 | 1752074 | 1789060 | 1818238 | 1826913 |
| 040 | 2 | 3 | 17 | Illinois | 12830632 | 12831572 | 12840545 | 12867783 | 12883029 | 12895778 | 12885092 | 12859585 | 12821709 | 12779893 | 12724685 | 12667017 | 12615162 | 12587530 |
| 040 | 2 | 3 | 18 | Indiana | 6483802 | 6484050 | 6490555 | 6517250 | 6538989 | 6570575 | 6596019 | 6611442 | 6637898 | 6662068 | 6698481 | 6731010 | 6752183 | 6754953 |
| 040 | 2 | 4 | 19 | Iowa | 3046355 | 3046877 | 3050819 | 3066772 | 3076844 | 3093935 | 3110643 | 3122541 | 3133210 | 3143734 | 3149900 | 3159596 | 3164115 | 3163561 |
| 040 | 2 | 4 | 20 | Kansas | 2853118 | 2853120 | 2858266 | 2869677 | 2886024 | 2894306 | 2901861 | 2910717 | 2912977 | 2910892 | 2912748 | 2912635 | 2915024 | 2913805 |
| 040 | 3 | 6 | 21 | Kentucky | 4339367 | 4339330 | 4348464 | 4370817 | 4387865 | 4406906 | 4416992 | 4429126 | 4440306 | 4455590 | 4464273 | 4472345 | 4477899 | 4477251 |
| 040 | 3 | 7 | 22 | Louisiana | 4533372 | 4533500 | 4544635 | 4576244 | 4602067 | 4626040 | 4645938 | 4666998 | 4681346 | 4673673 | 4664450 | 4658285 | 4650984 | 4645318 |
| 040 | 1 | 1 | 23 | Maine | 1328361 | 1328354 | 1327651 | 1328473 | 1328094 | 1328543 | 1331217 | 1329098 | 1332348 | 1335743 | 1340123 | 1345770 | 1349647 | 1350141 |
| 040 | 3 | 5 | 24 | Maryland | 5773552 | 5773787 | 5788784 | 5840241 | 5888375 | 5925197 | 5960064 | 5988528 | 6007014 | 6028186 | 6042153 | 6054954 | 6059529 | 6055802 |
| 040 | 1 | 1 | 25 | Massachusetts | 6547629 | 6547788 | 6566440 | 6614218 | 6664269 | 6715158 | 6764864 | 6797484 | 6827280 | 6863560 | 6885720 | 6894883 | 6898116 | 6893574 |
| 040 | 2 | 3 | 26 | Michigan | 9883640 | 9884112 | 9877597 | 9883053 | 9898289 | 9914802 | 9932033 | 9934483 | 9954117 | 9976752 | 9987286 | 9984795 | 9976330 | 9966555 |
| 040 | 2 | 4 | 27 | Minnesota | 5303925 | 5303933 | 5310934 | 5346620 | 5377500 | 5414722 | 5452665 | 5484002 | 5525360 | 5569283 | 5608762 | 5640053 | 5655855 | 5657342 |
| 040 | 3 | 6 | 28 | Mississippi | 2967297 | 2968129 | 2970615 | 2979147 | 2984599 | 2989839 | 2991892 | 2990231 | 2990595 | 2990674 | 2982879 | 2978227 | 2971253 | 2966786 |
| 040 | 2 | 4 | 29 | Missouri | 5988927 | 5988941 | 5996089 | 6011182 | 6026027 | 6042989 | 6059130 | 6075411 | 6091384 | 6111382 | 6125986 | 6140475 | 6151737 | 6151548 |
| 040 | 4 | 8 | 30 | Montana | 989415 | 989400 | 990730 | 997518 | 1004168 | 1014158 | 1022657 | 1031495 | 1042137 | 1053862 | 1061818 | 1070123 | 1078405 | 1080577 |
| 040 | 2 | 4 | 31 | Nebraska | 1826341 | 1826311 | 1829591 | 1840914 | 1853691 | 1865813 | 1879955 | 1892059 | 1906483 | 1916998 | 1925512 | 1932571 | 1937258 | 1937552 |
| 040 | 4 | 8 | 32 | Nevada | 2700551 | 2700683 | 2702483 | 2713114 | 2744670 | 2776956 | 2818935 | 2868531 | 2919555 | 2972097 | 3030725 | 3090771 | 3128500 | 3138259 |
| 040 | 1 | 1 | 33 | New Hampshire | 1316470 | 1316457 | 1316807 | 1320444 | 1324677 | 1327272 | 1334257 | 1337480 | 1343694 | 1350395 | 1355064 | 1360783 | 1365533 | 1366275 |
| 040 | 1 | 2 | 34 | New Jersey | 8791894 | 8791959 | 8799451 | 8828552 | 8845671 | 8857821 | 8867277 | 8870312 | 8873584 | 8888147 | 8891730 | 8891258 | 8890883 | 8882371 |
| 040 | 4 | 8 | 35 | New Mexico | 2059179 | 2059199 | 2064614 | 2080707 | 2087715 | 2092833 | 2090236 | 2090071 | 2092555 | 2092844 | 2093754 | 2099634 | 2106117 | 2106319 |
| 040 | 1 | 2 | 36 | New York | 19378102 | 19378117 | 19399956 | 19499921 | 19574362 | 19626488 | 19653431 | 19657321 | 19636391 | 19593849 | 19544098 | 19463131 | 19382373 | 19336776 |
| 040 | 3 | 5 | 37 | North Carolina | 9535483 | 9535762 | 9574586 | 9658913 | 9751810 | 9846717 | 9937295 | 10037218 | 10161802 | 10275758 | 10391358 | 10501384 | 10581885 | 10600823 |
| 040 | 2 | 4 | 38 | North Dakota | 672591 | 672575 | 674752 | 685526 | 702227 | 723149 | 738736 | 755537 | 756114 | 756755 | 760062 | 763724 | 765224 | 765309 |
| 040 | 2 | 3 | 39 | Ohio | 11536504 | 11536763 | 11539449 | 11545735 | 11550971 | 11579692 | 11606573 | 11622315 | 11640060 | 11665706 | 11680892 | 11696507 | 11699855 | 11693217 |
| 040 | 3 | 7 | 40 | Oklahoma | 3751351 | 3751582 | 3760014 | 3788824 | 3819320 | 3853891 | 3879187 | 3910518 | 3928143 | 3933602 | 3943488 | 3960676 | 3977682 | 3980783 |
| 040 | 4 | 9 | 41 | Oregon | 3831074 | 3831083 | 3837614 | 3872672 | 3900102 | 3924110 | 3965447 | 4018542 | 4093271 | 4147294 | 4183538 | 4216116 | 4237408 | 4241507 |
| 040 | 1 | 2 | 42 | Pennsylvania | 12702379 | 12702891 | 12711406 | 12747052 | 12769123 | 12779538 | 12792392 | 12789838 | 12788468 | 12794679 | 12809107 | 12798883 | 12794404 | 12783254 |
| 040 | 1 | 1 | 44 | Rhode Island | 1052567 | 1052970 | 1053994 | 1053829 | 1054893 | 1055560 | 1056511 | 1056886 | 1057816 | 1056554 | 1059338 | 1058158 | 1058004 | 1057125 |
| 040 | 3 | 5 | 45 | South Carolina | 4625364 | 4625358 | 4635846 | 4672655 | 4719027 | 4766469 | 4826858 | 4896006 | 4963031 | 5027102 | 5091702 | 5157702 | 5205864 | 5218040 |
| 040 | 2 | 4 | 46 | South Dakota | 814180 | 814198 | 816193 | 823740 | 833859 | 842751 | 849670 | 854663 | 863693 | 873732 | 879386 | 887127 | 891688 | 892717 |
| 040 | 3 | 6 | 47 | Tennessee | 6346105 | 6346281 | 6355518 | 6400298 | 6455752 | 6496943 | 6544617 | 6595354 | 6651277 | 6714748 | 6778180 | 6830325 | 6875939 | 6886834 |
| 040 | 3 | 7 | 48 | Texas | 25145561 | 25146072 | 25241897 | 25645504 | 26084120 | 26479646 | 26963092 | 27468531 | 27914064 | 28291024 | 28624564 | 28986794 | 29286467 | 29360759 |
| 040 | 4 | 8 | 49 | Utah | 2763885 | 2763891 | 2775413 | 2814797 | 2854146 | 2898773 | 2938327 | 2983626 | 3044241 | 3103540 | 3155153 | 3203383 | 3239542 | 3249879 |
| 040 | 1 | 1 | 50 | Vermont | 625741 | 625727 | 625886 | 627197 | 626361 | 626603 | 625693 | 625810 | 624366 | 625132 | 624802 | 624046 | 623821 | 623347 |
| 040 | 3 | 5 | 51 | Virginia | 8001024 | 8001046 | 8024004 | 8102437 | 8187456 | 8255861 | 8315430 | 8367303 | 8417651 | 8471011 | 8510920 | 8556642 | 8587217 | 8590563 |
| 040 | 4 | 9 | 53 | Washington | 6724540 | 6724540 | 6743009 | 6827479 | 6898599 | 6966252 | 7057531 | 7167287 | 7299961 | 7427951 | 7526793 | 7614024 | 7678379 | 7693612 |
| 040 | 3 | 5 | 54 | West Virginia | 1852994 | 1853008 | 1854265 | 1856606 | 1857446 | 1854768 | 1850569 | 1843332 | 1832435 | 1818683 | 1805953 | 1795263 | 1788150 | 1784787 |
| 040 | 2 | 3 | 55 | Wisconsin | 5686986 | 5687285 | 5690538 | 5705840 | 5720825 | 5738012 | 5753199 | 5762927 | 5775170 | 5793147 | 5809319 | 5824581 | 5833464 | 5832655 |
| 040 | 4 | 8 | 56 | Wyoming | 563626 | 563775 | 564531 | 567491 | 576656 | 582620 | 583159 | 586389 | 585243 | 579994 | 579054 | 580116 | 582030 | 582328 |
| 040 | X | X | 72 | Puerto Rico | 3725789 | 3726157 | 3721525 | 3678732 | 3634488 | 3593077 | 3534874 | 3473232 | 3406672 | 3325284 | 3193344 | 3193553 | 3167851 | 3159343 |
National population data
We can use the SUMLEV variable to obtain only national data:
| SUMLEV | REGION | DIVISION | STATE | NAME | CENSUS2010POP | ESTIMATESBASE2010 | POPESTIMATE2010 | POPESTIMATE2011 | POPESTIMATE2012 | POPESTIMATE2013 | POPESTIMATE2014 | POPESTIMATE2015 | POPESTIMATE2016 | POPESTIMATE2017 | POPESTIMATE2018 | POPESTIMATE2019 | POPESTIMATE042020 | POPESTIMATE2020 |
|---|---|---|---|---|---|---|---|---|---|---|---|---|---|---|---|---|---|---|
| 010 | 0 | 0 | 00 | United States | 308745538 | 308758105 | 309327143 | 311583481 | 313877662 | 316059947 | 318386329 | 320738994 | 323071755 | 325122128 | 326838199 | 328329953 | 329398742 | 329484123 |
National population data
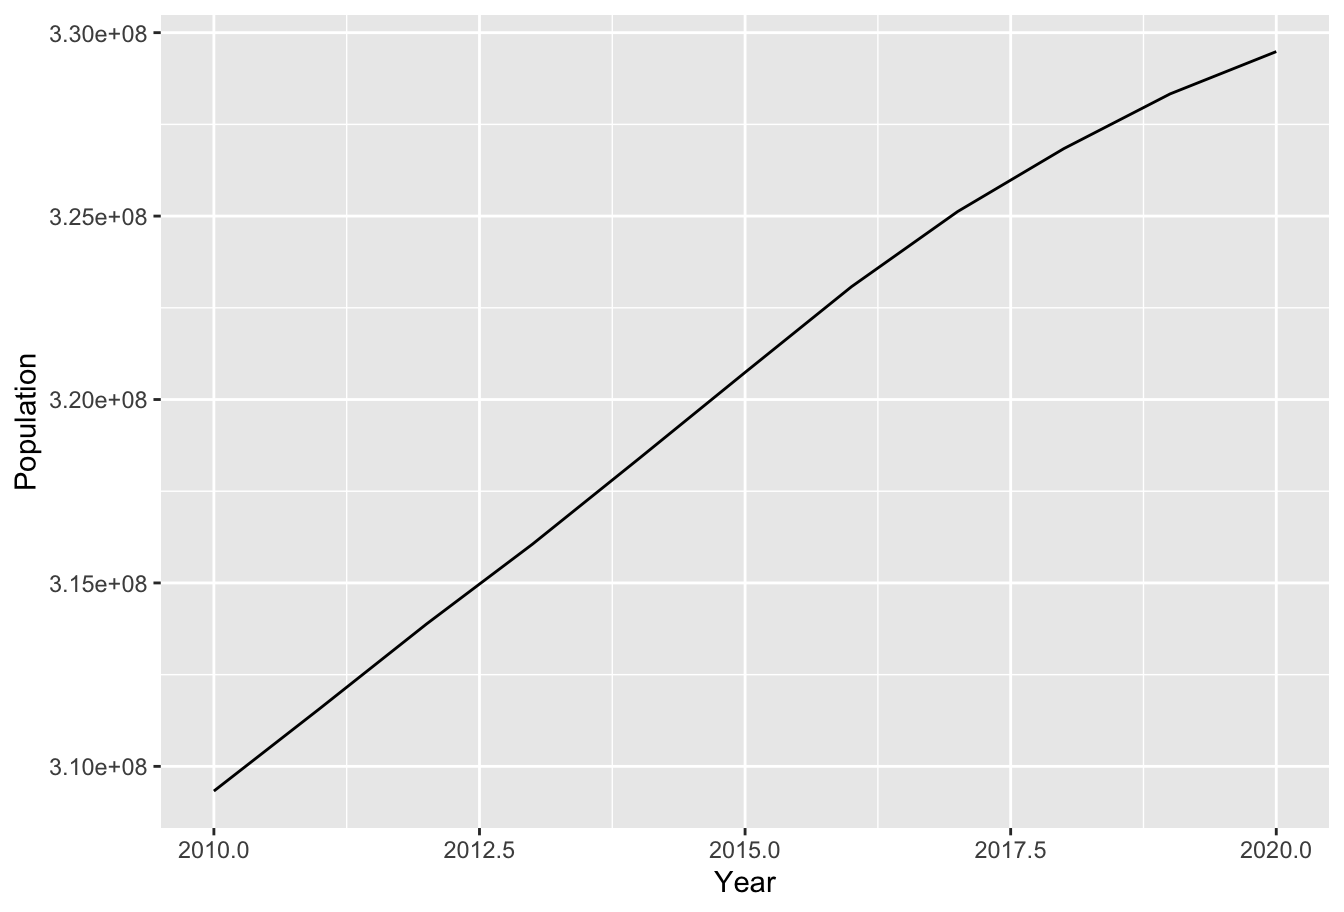
How can we generate the following plot?
National population data
Note that our data cannot be readily used with ggplot to generate the previous plot. Ideally, we would like two vectors of the same length: one representing Year and one representing Population.
Manipulating data for visualization
| SUMLEV | REGION | DIVISION | STATE | NAME | CENSUS2010POP | ESTIMATESBASE2010 | POPESTIMATE2010 | POPESTIMATE2011 | POPESTIMATE2012 | POPESTIMATE2013 | POPESTIMATE2014 | POPESTIMATE2015 | POPESTIMATE2016 | POPESTIMATE2017 | POPESTIMATE2018 | POPESTIMATE2019 | POPESTIMATE042020 | POPESTIMATE2020 |
|---|---|---|---|---|---|---|---|---|---|---|---|---|---|---|---|---|---|---|
| 010 | 0 | 0 | 00 | United States | 308745538 | 308758105 | 309327143 | 311583481 | 313877662 | 316059947 | 318386329 | 320738994 | 323071755 | 325122128 | 326838199 | 328329953 | 329398742 | 329484123 |
Approach 1: Build a data frame manually
  Year Population.POPESTIMATE2010 Population.POPESTIMATE2011
1 2010                  309327143                  311583481
2 2011                  309327143                  311583481
3 2012                  309327143                  311583481
4 2013                  309327143                  311583481
5 2014                  309327143                  311583481
6 2015                  309327143                  311583481
  Population.POPESTIMATE2012 Population.POPESTIMATE2013
1                  313877662                  316059947
2                  313877662                  316059947
3                  313877662                  316059947
4                  313877662                  316059947
5                  313877662                  316059947
6                  313877662                  316059947
  Population.POPESTIMATE2014 Population.POPESTIMATE2015
1                  318386329                  320738994
2                  318386329                  320738994
3                  318386329                  320738994
4                  318386329                  320738994
5                  318386329                  320738994
6                  318386329                  320738994
  Population.POPESTIMATE2016 Population.POPESTIMATE2017
1                  323071755                  325122128
2                  323071755                  325122128
3                  323071755                  325122128
4                  323071755                  325122128
5                  323071755                  325122128
6                  323071755                  325122128
  Population.POPESTIMATE2018 Population.POPESTIMATE2019
1                  326838199                  328329953
2                  326838199                  328329953
3                  326838199                  328329953
4                  326838199                  328329953
5                  326838199                  328329953
6                  326838199                  328329953
  Population.POPESTIMATE042020 Population.POPESTIMATE2020
1                    329398742                  329484123
2                    329398742                  329484123
3                    329398742                  329484123
4                    329398742                  329484123
5                    329398742                  329484123
6                    329398742                  329484123
National population data
What went wrong? US_pop[1, 8:19] is a tibble, and we need a numeric.
Error in data.frame(Year = 2010:2020, Population = as.numeric(US_pop[1, : arguments imply differing number of rows: 11, 12National population data
Now what? US_pop has an extra column POPESTIMATE042020 which we need to remove.
National population data
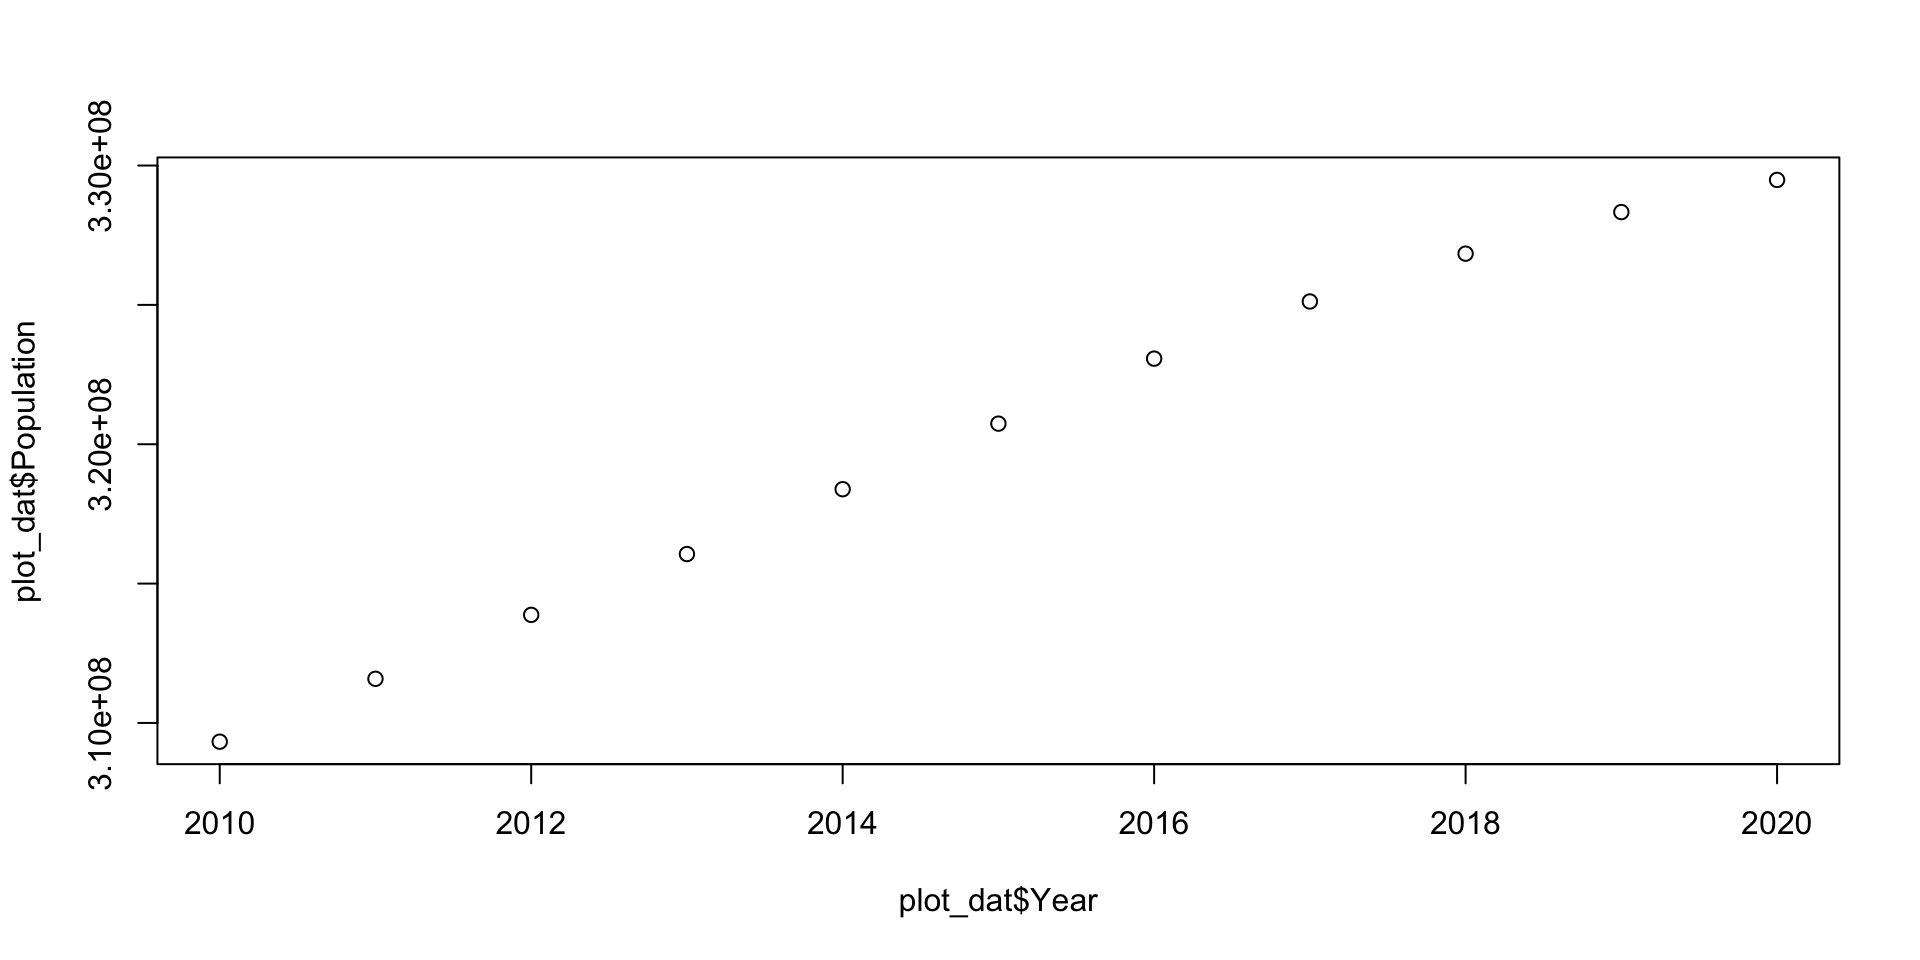
Finally, we can use the plot function to get our desired visualization:
Approach 2: Tidyverse
Now let’s see how we might approach the same task in the tidyverse. Our strategy will be to “tidy” the data so we have one row for each observation and one column for each observation.
First, let’s remove the unnecessary column using the select() function.
| SUMLEV | REGION | DIVISION | STATE | NAME | CENSUS2010POP | ESTIMATESBASE2010 | POPESTIMATE2010 | POPESTIMATE2011 | POPESTIMATE2012 | POPESTIMATE2013 | POPESTIMATE2014 | POPESTIMATE2015 | POPESTIMATE2016 | POPESTIMATE2017 | POPESTIMATE2018 | POPESTIMATE2019 | POPESTIMATE2020 |
|---|---|---|---|---|---|---|---|---|---|---|---|---|---|---|---|---|---|
| 010 | 0 | 0 | 00 | United States | 308745538 | 308758105 | 309327143 | 311583481 | 313877662 | 316059947 | 318386329 | 320738994 | 323071755 | 325122128 | 326838199 | 328329953 | 329484123 |
Tidyverse strategy
Now let’s use the pivot_longer function to combine the POPESTIMATE columns into two variables: Year and Population:
Tidyverse strategy
| SUMLEV | REGION | DIVISION | STATE | NAME | CENSUS2010POP | ESTIMATESBASE2010 | Year | Population |
|---|---|---|---|---|---|---|---|---|
| 010 | 0 | 0 | 00 | United States | 308745538 | 308758105 | POPESTIMATE2010 | 309327143 |
| 010 | 0 | 0 | 00 | United States | 308745538 | 308758105 | POPESTIMATE2011 | 311583481 |
| 010 | 0 | 0 | 00 | United States | 308745538 | 308758105 | POPESTIMATE2012 | 313877662 |
| 010 | 0 | 0 | 00 | United States | 308745538 | 308758105 | POPESTIMATE2013 | 316059947 |
| 010 | 0 | 0 | 00 | United States | 308745538 | 308758105 | POPESTIMATE2014 | 318386329 |
| 010 | 0 | 0 | 00 | United States | 308745538 | 308758105 | POPESTIMATE2015 | 320738994 |
| 010 | 0 | 0 | 00 | United States | 308745538 | 308758105 | POPESTIMATE2016 | 323071755 |
| 010 | 0 | 0 | 00 | United States | 308745538 | 308758105 | POPESTIMATE2017 | 325122128 |
| 010 | 0 | 0 | 00 | United States | 308745538 | 308758105 | POPESTIMATE2018 | 326838199 |
| 010 | 0 | 0 | 00 | United States | 308745538 | 308758105 | POPESTIMATE2019 | 328329953 |
| 010 | 0 | 0 | 00 | United States | 308745538 | 308758105 | POPESTIMATE2020 | 329484123 |
What do we need to do next?
Tidyverse strategy
Finally, we need to use the str_sub() function to shorten our Year variable before turning it into a numeric.
Tidyverse strategy
Now, Year is numeric as desired:
| SUMLEV | REGION | DIVISION | STATE | NAME | CENSUS2010POP | ESTIMATESBASE2010 | Year | Population |
|---|---|---|---|---|---|---|---|---|
| 010 | 0 | 0 | 00 | United States | 308745538 | 308758105 | 2010 | 309327143 |
| 010 | 0 | 0 | 00 | United States | 308745538 | 308758105 | 2011 | 311583481 |
| 010 | 0 | 0 | 00 | United States | 308745538 | 308758105 | 2012 | 313877662 |
| 010 | 0 | 0 | 00 | United States | 308745538 | 308758105 | 2013 | 316059947 |
| 010 | 0 | 0 | 00 | United States | 308745538 | 308758105 | 2014 | 318386329 |
| 010 | 0 | 0 | 00 | United States | 308745538 | 308758105 | 2015 | 320738994 |
| 010 | 0 | 0 | 00 | United States | 308745538 | 308758105 | 2016 | 323071755 |
| 010 | 0 | 0 | 00 | United States | 308745538 | 308758105 | 2017 | 325122128 |
| 010 | 0 | 0 | 00 | United States | 308745538 | 308758105 | 2018 | 326838199 |
| 010 | 0 | 0 | 00 | United States | 308745538 | 308758105 | 2019 | 328329953 |
| 010 | 0 | 0 | 00 | United States | 308745538 | 308758105 | 2020 | 329484123 |
Tidyverse strategy
Now we can |> it to ggplot:
Tidyverse strategy

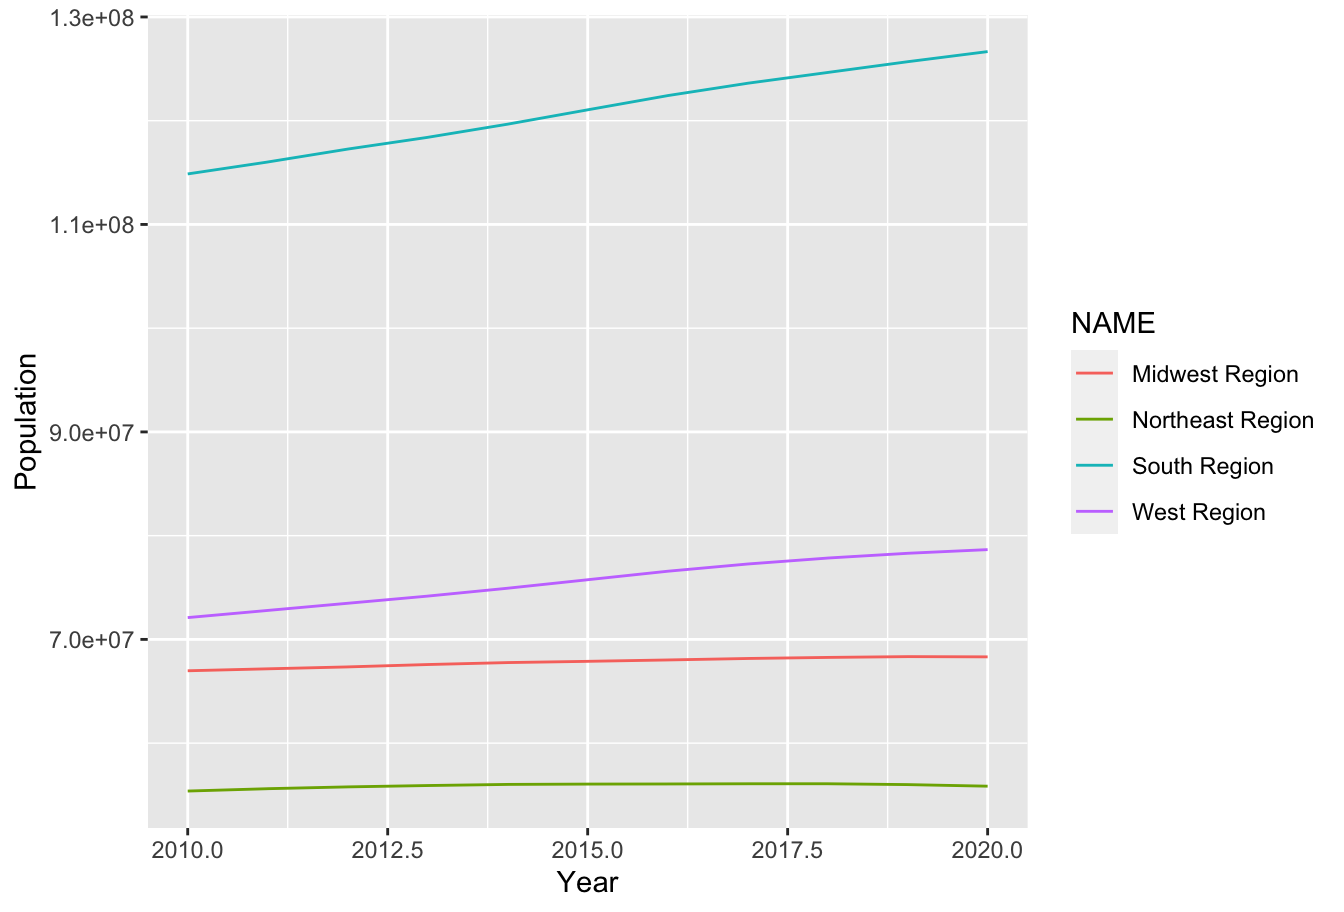
Tidyverse strategy: More complicated plots
We can also work with the region level data, mapping the color aesthetic to the region:
Tidyverse strategy: More complicated plots
Example: World Bank Inflation Data
The World Bank provides historical data on inflation in countries around the world here.
In particular, let’s explore the annual consumer price inflation data for the US.
The consumer price inflation measures the “annual percentage change in the cost to the average consumer of acquiring a basket of goods.”
Example: World Bank Inflation Data
| Country.Code | IMF.Country.Code | Country | Indicator.Type | Series.Name | 1970 | 1971 | 1972 | 1973 | 1974 | 1975 | 1976 | 1977 | 1978 | 1979 | 1980 | 1981 | 1982 | 1983 | 1984 | 1985 | 1986 | 1987 | 1988 | 1989 | 1990 | 1991 | 1992 | 1993 | 1994 | 1995 | 1996 | 1997 | 1998 | 1999 | 2000 | 2001 | 2002 | 2003 | 2004 | 2005 | 2006 | 2007 | 2008 | 2009 | 2010 | 2011 | 2012 | 2013 | 2014 | 2015 | 2016 | 2017 | 2018 | 2019 | 2020 | 2021 | 2022 | Note |
|---|---|---|---|---|---|---|---|---|---|---|---|---|---|---|---|---|---|---|---|---|---|---|---|---|---|---|---|---|---|---|---|---|---|---|---|---|---|---|---|---|---|---|---|---|---|---|---|---|---|---|---|---|---|---|---|---|---|---|
| ABW | 314 | Aruba | Inflation | Headline Consumer Price Inflation | NA | NA | NA | NA | NA | NA | NA | NA | NA | NA | NA | NA | NA | NA | NA | NA | NA | NA | NA | NA | NA | NA | NA | NA | NA | NA | 3.200 | 2.996 | 1.875 | 2.277 | 4.049 | 2.890 | 3.320 | 3.660 | 2.530 | 3.400 | 3.610 | 5.390 | 8.960 | -2.140 | 2.080 | 4.320 | 0.630 | -2.370 | 0.420 | 0.480 | -0.890 | -0.474 | 3.58 | 4.257 | 1.222 | 0.744 | 5.520 | Annual average inflation |
| AFG | 512 | Afghanistan | Inflation | Headline Consumer Price Inflation | 25.510 | 25.510 | -12.520 | -10.680 | 10.230 | 11.850 | 0.600 | 7.650 | 5.000 | 9.900 | 13.400 | 22.200 | 18.200 | 15.900 | 20.400 | 8.700 | -2.100 | 18.400 | 27.500 | 71.500 | 47.400 | 43.800 | 58.190 | 33.990 | 20.010 | 14.000 | 14.010 | 14.010 | 14.010 | 14.010 | 0.001 | -43.400 | 51.930 | 35.663 | 16.358 | 10.569 | 6.780 | 8.680 | 26.420 | -6.810 | 2.180 | 11.800 | 6.440 | 7.390 | 4.670 | -0.660 | 4.380 | 4.976 | 0.63 | 2.302 | 5.443 | 5.062 | NA | Annual average inflation |
| AGO | 614 | Angola | Inflation | Headline Consumer Price Inflation | 7.970 | 5.780 | 15.800 | 15.670 | 27.420 | 29.000 | 80.700 | 69.010 | 48.460 | 101.300 | 46.708 | 1.391 | 1.833 | 1.833 | 1.833 | 1.833 | 1.833 | 1.833 | 1.833 | 1.833 | 1.833 | 85.265 | 299.097 | 1379.476 | 949.771 | 2672.230 | 4146.010 | 221.492 | 107.429 | 248.248 | 325.029 | 152.586 | 108.893 | 98.219 | 43.525 | 22.961 | 13.305 | 12.249 | 12.465 | 13.721 | 14.480 | 13.484 | 10.285 | 8.782 | 7.298 | 9.159 | 32.378 | 29.844 | 19.63 | 17.079 | 21.024 | 23.846 | 23.827 | Annual average inflation |
| ALB | 914 | Albania | Inflation | Headline Consumer Price Inflation | NA | NA | NA | NA | NA | NA | NA | NA | NA | NA | NA | NA | NA | NA | NA | NA | NA | NA | NA | NA | -0.180 | 35.717 | 225.996 | 85.005 | 22.565 | 7.755 | 12.799 | 33.212 | 20.552 | 0.402 | 0.025 | 3.105 | 5.185 | 2.378 | 2.830 | 2.357 | 2.410 | 2.908 | 3.405 | 2.290 | 3.565 | 3.415 | 2.028 | 1.935 | 1.622 | 1.910 | 1.291 | 1.987 | 2.03 | 1.411 | 1.621 | 2.041 | 6.725 | Annual average inflation |
| ARE | 466 | United Arab Emirates | Inflation | Headline Consumer Price Inflation | 21.985 | 21.985 | 21.985 | 21.985 | 21.985 | 21.985 | 21.985 | 21.970 | 13.043 | 10.989 | 10.066 | 7.946 | 7.083 | 1.297 | 2.433 | 3.500 | 5.435 | 5.498 | 4.995 | 2.792 | 0.604 | 3.400 | 6.383 | 5.273 | 5.699 | 4.330 | 2.976 | 2.966 | 1.994 | 2.100 | 1.348 | 2.800 | 2.918 | 3.119 | 5.041 | 6.195 | 9.285 | 11.128 | 12.272 | 1.570 | 0.884 | 0.883 | 0.663 | 1.094 | 2.344 | 4.067 | 1.620 | 1.967 | 3.06 | -1.931 | -2.079 | 0.180 | 4.828 | Annual average inflation |
| ARG | 213 | Argentina | Inflation | Headline Consumer Price Inflation | 13.587 | 34.732 | 58.446 | 61.249 | 23.475 | 182.927 | 443.966 | 176.002 | 175.515 | 159.507 | 100.764 | 104.476 | 164.777 | 343.811 | 626.719 | 672.181 | 90.097 | 131.327 | 342.955 | 3079.810 | 2313.960 | 171.672 | 24.900 | 10.611 | 4.177 | 3.376 | 0.156 | 0.527 | 0.925 | -1.167 | -0.939 | -1.065 | 25.869 | 13.443 | 4.416 | 9.642 | 10.898 | 8.830 | 8.585 | 6.270 | 10.461 | 9.775 | 10.043 | 10.619 | 38.081 | 26.538 | 39.400 | 25.675 | 34.28 | 53.548 | 42.015 | 48.409 | 72.431 | Annual average inflation |
| ARM | 911 | Armenia | Inflation | Headline Consumer Price Inflation | NA | NA | NA | NA | NA | NA | NA | NA | NA | NA | NA | NA | NA | NA | NA | NA | NA | NA | NA | NA | NA | NA | NA | 3731.800 | 5273.449 | 176.743 | 18.653 | 14.046 | 8.673 | 0.648 | -0.791 | 3.146 | 1.790 | 4.543 | 5.928 | 0.717 | 3.433 | 4.553 | 9.018 | 3.544 | 7.274 | 7.653 | 2.540 | 5.788 | 2.981 | 3.731 | -1.406 | 1.031 | 2.52 | 1.443 | 1.211 | 7.185 | 8.641 | Annual average inflation |
| ATG | 311 | Antigua and Barbuda | Inflation | Headline Consumer Price Inflation | 8.870 | 8.630 | 12.670 | 21.720 | 12.970 | 8.610 | 15.620 | 13.750 | 6.150 | 16.330 | 18.999 | 11.465 | 4.170 | 2.346 | 3.844 | 0.996 | 0.500 | 3.602 | 6.800 | 4.362 | 6.591 | 4.518 | 3.000 | 3.100 | 6.485 | 2.737 | 2.965 | 0.362 | 3.262 | 1.135 | -0.162 | 1.935 | 2.408 | 1.994 | 2.030 | 2.099 | 1.788 | 1.416 | 5.334 | -0.550 | 3.370 | 3.457 | 3.377 | 1.059 | 1.089 | 0.969 | -0.489 | 2.425 | 1.21 | 1.475 | 1.058 | 1.627 | 7.531 | Annual average inflation |
| AUS | 193 | Australia | Inflation | Headline Consumer Price Inflation | 3.440 | 6.138 | 6.024 | 9.091 | 15.417 | 15.162 | 13.323 | 12.310 | 8.005 | 9.122 | 10.136 | 9.488 | 11.352 | 10.039 | 3.960 | 6.735 | 9.050 | 8.533 | 7.216 | 7.534 | 7.333 | 3.177 | 1.012 | 1.754 | 1.970 | 4.628 | 2.615 | 0.225 | 0.860 | 1.483 | 4.457 | 4.407 | 2.982 | 2.733 | 2.343 | 2.692 | 3.555 | 2.328 | 4.350 | 1.771 | 2.918 | 3.304 | 1.763 | 2.450 | 2.488 | 1.508 | 1.277 | 1.972 | 1.91 | 1.610 | 0.847 | 2.820 | 6.594 | Annual average inflation |
| AUT | 122 | Austria | Inflation | Headline Consumer Price Inflation | 4.370 | 4.704 | 6.355 | 7.531 | 9.522 | 8.445 | 7.319 | 5.495 | 3.574 | 3.707 | 6.328 | 6.803 | 5.436 | 3.339 | 5.663 | 3.190 | 1.705 | 1.402 | 1.916 | 2.568 | 3.262 | 3.337 | 4.021 | 3.632 | 2.953 | 2.243 | 1.861 | 1.306 | 0.922 | 0.569 | 2.345 | 2.650 | 1.810 | 1.356 | 2.061 | 2.299 | 1.442 | 2.169 | 3.216 | 0.506 | 1.814 | 3.287 | 2.486 | 2.000 | 1.606 | 0.897 | 0.892 | 2.230 | 2.00 | 1.490 | 1.382 | 2.767 | 8.547 | Annual average inflation |
| AZE | 912 | Azerbaijan | Inflation | Headline Consumer Price Inflation | NA | NA | NA | NA | NA | NA | NA | NA | NA | NA | NA | NA | NA | NA | NA | NA | NA | NA | NA | NA | NA | 106.600 | 917.000 | 1129.700 | 1664.000 | 411.760 | 19.795 | 3.674 | -0.773 | -8.525 | 1.805 | 1.863 | 2.777 | 2.131 | 6.707 | 9.542 | 8.232 | 16.566 | 20.797 | 1.332 | 5.685 | 7.772 | 1.010 | 2.432 | 1.433 | 4.033 | 12.441 | 12.844 | 2.33 | 2.712 | 2.760 | 6.650 | 13.852 | Annual average inflation |
| BDI | 618 | Burundi | Inflation | Headline Consumer Price Inflation | -0.200 | 3.851 | 3.829 | 6.006 | 15.722 | 15.710 | 6.857 | 6.835 | 23.896 | 36.541 | 1.200 | 12.178 | 5.854 | 8.158 | 14.301 | 3.821 | 1.668 | 7.108 | 4.490 | 11.667 | 6.991 | 9.011 | 5.328 | 9.714 | 14.713 | 19.361 | 26.416 | 31.063 | 12.471 | 3.522 | 24.430 | 9.300 | -1.370 | 10.650 | 8.180 | 13.250 | 2.750 | 8.410 | 24.410 | 10.560 | 6.490 | 9.590 | 18.160 | 7.940 | 4.410 | 5.540 | 5.560 | 16.643 | -2.81 | -0.709 | 7.321 | 8.313 | 18.801 | Annual average inflation |
| BEL | 124 | Belgium | Inflation | Headline Consumer Price Inflation | 3.910 | 4.344 | 5.448 | 6.955 | 12.678 | 12.768 | 9.069 | 7.096 | 4.471 | 4.469 | 6.649 | 7.627 | 8.727 | 7.662 | 6.342 | 4.869 | 1.294 | 1.553 | 1.161 | 3.107 | 3.448 | 3.215 | 2.428 | 2.754 | 2.378 | 1.468 | 2.077 | 1.628 | 0.949 | 1.121 | 2.545 | 2.469 | 1.645 | 1.589 | 2.097 | 2.781 | 1.791 | 1.823 | 4.489 | -0.053 | 2.189 | 3.532 | 2.840 | 1.113 | 0.340 | 0.561 | 1.974 | 2.224 | 2.05 | 1.249 | 0.741 | 2.440 | 9.598 | Annual average inflation |
| BEN | 638 | Benin | Inflation | Headline Consumer Price Inflation | 6.320 | 2.770 | 3.900 | 6.870 | 14.420 | -34.410 | 8.260 | 9.860 | 6.840 | 10.270 | 9.596 | 0.795 | 4.059 | -6.067 | 10.265 | 1.151 | 0.414 | -1.339 | 3.445 | -0.202 | 1.112 | 2.100 | 5.921 | 0.445 | 38.535 | 14.458 | 4.917 | 3.803 | 5.755 | 0.348 | 4.210 | 3.981 | 2.422 | 1.507 | 0.883 | 5.364 | 3.787 | 1.294 | 7.939 | 0.398 | 2.179 | 2.720 | 6.740 | 0.890 | -1.010 | 0.270 | -0.850 | 1.769 | 0.83 | -0.933 | 3.023 | 5.917 | 1.351 | Annual average inflation |
| BFA | 748 | Burkina Faso | Inflation | Headline Consumer Price Inflation | 1.773 | 2.061 | -2.923 | 7.604 | 8.720 | 18.757 | -8.401 | 29.986 | 8.269 | 14.993 | 12.259 | 7.556 | 12.058 | 8.346 | 4.847 | 7.054 | -2.700 | -2.850 | 4.191 | -0.322 | -0.807 | 2.502 | -1.991 | 0.614 | 24.720 | 7.772 | 6.109 | 2.929 | 4.911 | -1.080 | -0.169 | 4.727 | 2.300 | 2.040 | -0.400 | 6.409 | 2.336 | -0.233 | 10.668 | 0.864 | -0.608 | 2.760 | 3.820 | 0.530 | -0.260 | 0.950 | -0.240 | 0.351 | 1.96 | -3.233 | 1.884 | 3.848 | 14.290 | Annual average inflation |
| BGD | 513 | Bangladesh | Inflation | Headline Consumer Price Inflation | 3.540 | -0.590 | 45.290 | 45.010 | 54.650 | 16.620 | -2.430 | 9.340 | 17.370 | 13.590 | 15.385 | 14.545 | 12.875 | 9.531 | 10.414 | 10.465 | 10.175 | 10.828 | 9.674 | 8.734 | 10.522 | 8.285 | 3.624 | 2.979 | 6.150 | 10.117 | 2.455 | 4.959 | 8.648 | 6.179 | 2.483 | 1.908 | 3.719 | 5.361 | 6.103 | 7.040 | 6.770 | 9.109 | 8.900 | 5.441 | 8.151 | 10.264 | 6.549 | 7.524 | 6.983 | 6.186 | 5.506 | 5.611 | 5.55 | 5.475 | 5.691 | 5.307 | 7.697 | Annual average inflation |
| BGR | 918 | Bulgaria | Inflation | Headline Consumer Price Inflation | -0.400 | -0.100 | 0.000 | 0.000 | 0.000 | 0.000 | 0.000 | 0.000 | 0.000 | 0.000 | 0.000 | 0.002 | 2.800 | 2.800 | 2.800 | 2.800 | 2.700 | 2.700 | 2.500 | 6.404 | 23.900 | 333.500 | 91.317 | 72.824 | 96.866 | 61.455 | 125.528 | 1037.480 | 17.802 | 2.555 | 10.305 | 7.450 | 5.863 | 2.389 | 6.142 | 5.028 | 7.255 | 8.416 | 12.348 | 2.747 | 2.443 | 4.218 | 2.954 | 0.889 | -1.414 | -0.098 | -0.795 | 1.188 | 2.81 | 2.457 | 1.673 | 2.787 | 15.325 | Annual average inflation |
| BHR | 419 | Bahrain | Inflation | Headline Consumer Price Inflation | 1.629 | 5.789 | 5.088 | 14.332 | 24.393 | 16.160 | 22.496 | 17.731 | 15.785 | 2.206 | 3.800 | 11.400 | 8.700 | 3.200 | 0.000 | -2.400 | -2.500 | -1.700 | 0.200 | 1.200 | 1.299 | 0.899 | -0.302 | 2.599 | 3.999 | 3.139 | -0.185 | 4.602 | -0.418 | -1.259 | -0.730 | -1.175 | -0.496 | 1.679 | 2.248 | 2.618 | 2.041 | 3.252 | 3.520 | 2.797 | 1.961 | -0.373 | 2.771 | 3.296 | 2.653 | 1.836 | 2.800 | 1.387 | 2.08 | 1.000 | -2.318 | -0.606 | 3.626 | Annual average inflation |
| BHS | 313 | Bahamas, The | Inflation | Headline Consumer Price Inflation | 6.152 | 4.615 | 6.831 | 5.482 | 13.072 | 10.360 | 4.256 | 3.190 | 6.109 | 9.091 | 12.231 | 11.046 | 6.101 | 4.000 | 3.966 | 4.624 | 5.414 | 5.994 | 4.051 | 5.405 | 4.628 | 7.304 | 5.577 | 2.748 | 1.367 | 2.023 | 1.262 | 0.561 | 1.207 | 1.119 | 1.732 | 2.362 | 1.498 | 3.656 | 1.160 | 1.819 | 1.958 | 2.407 | 4.434 | 1.666 | 1.621 | 3.200 | 1.970 | 0.720 | 1.510 | 1.870 | -0.350 | 1.553 | 2.23 | 1.335 | 0.039 | 2.905 | 5.605 | Annual average inflation |
| BIH | 963 | Bosnia and Herzegovina | Inflation | Headline Consumer Price Inflation | NA | NA | NA | NA | NA | NA | NA | NA | NA | NA | NA | NA | NA | NA | NA | NA | NA | NA | NA | NA | NA | NA | NA | NA | NA | 12.901 | -11.717 | 5.732 | -0.279 | 2.841 | 4.973 | 4.573 | 0.313 | 0.547 | 0.282 | 3.582 | 6.083 | 1.547 | 7.399 | -0.390 | 2.208 | 3.658 | 2.058 | -0.091 | -0.923 | -1.015 | -1.059 | 0.810 | 1.27 | 0.617 | -1.051 | 1.982 | 14.021 | Annual average inflation |
| BLR | 913 | Belarus | Inflation | Headline Consumer Price Inflation | 0.000 | -0.400 | -0.200 | 0.000 | -0.100 | 0.100 | 0.100 | 0.200 | 0.900 | 1.200 | 1.100 | 1.200 | 3.100 | 1.000 | -0.700 | 0.500 | 2.300 | 1.600 | 0.000 | 1.800 | 4.600 | 94.200 | 970.700 | 1190.316 | 2220.897 | 685.185 | 51.651 | 64.075 | 73.270 | 294.639 | 167.577 | 60.845 | 42.650 | 28.492 | 18.241 | 10.373 | 6.958 | 8.295 | 14.734 | 12.835 | 7.662 | 53.175 | 59.499 | 18.332 | 18.095 | 13.476 | 11.803 | 6.032 | 4.87 | 5.600 | 5.548 | 9.460 | 15.210 | Annual average inflation |
| BLZ | 339 | Belize | Inflation | Headline Consumer Price Inflation | 21.410 | 18.630 | 20.730 | 66.960 | 20.780 | 20.770 | -2.900 | 12.150 | 4.870 | -11.820 | 7.051 | 11.224 | 6.839 | 4.996 | 3.383 | 4.153 | 0.794 | 2.021 | 5.321 | 0.000 | 2.047 | 3.225 | 2.397 | 1.473 | 2.569 | 2.890 | 6.425 | 1.026 | -0.847 | -1.207 | 0.614 | 1.150 | 2.200 | 2.620 | 3.070 | 3.651 | 4.240 | 2.318 | 6.394 | -1.104 | 0.918 | 1.695 | 1.300 | 0.507 | 1.203 | -0.852 | 0.665 | 1.148 | 0.24 | 0.187 | 0.120 | 3.260 | 6.266 | Annual average inflation |
| BOL | 218 | Bolivia | Inflation | Headline Consumer Price Inflation | 3.956 | 0.000 | 5.556 | 34.211 | 41.176 | 9.722 | 12.658 | 7.865 | 6.250 | 20.588 | 48.780 | 32.240 | 126.446 | 273.358 | 1289.541 | 11702.827 | 273.555 | 14.433 | 15.988 | 15.248 | 17.181 | 21.442 | 12.043 | 8.512 | 7.867 | 10.193 | 12.430 | 4.704 | 7.670 | 2.156 | 4.606 | 1.602 | 0.929 | 3.343 | 4.438 | 5.399 | 2.335 | 8.705 | 14.010 | 3.342 | 2.496 | 9.884 | 4.515 | 5.736 | 5.764 | 4.064 | 3.627 | 2.820 | 2.27 | 1.839 | 0.941 | 0.737 | 1.746 | Annual average inflation |
| BRA | 223 | Brazil | Inflation | Headline Consumer Price Inflation | 22.260 | 20.140 | 16.520 | 12.650 | 27.590 | 28.920 | 42.010 | 43.650 | 38.700 | 53.920 | 90.227 | 101.725 | 100.543 | 135.028 | 192.122 | 225.990 | 147.143 | 228.336 | 629.113 | 1430.725 | 2947.733 | 432.787 | 951.962 | 1927.381 | 2075.888 | 66.007 | 15.758 | 6.927 | 3.195 | 4.858 | 7.044 | 6.840 | 8.450 | 14.715 | 6.597 | 6.870 | 4.184 | 3.641 | 5.679 | 4.888 | 5.039 | 6.636 | 5.404 | 6.204 | 6.329 | 9.030 | 8.739 | 3.446 | 3.66 | 3.733 | 3.212 | 8.302 | 9.280 | Annual average inflation |
| BRB | 316 | Barbados | Inflation | Headline Consumer Price Inflation | 7.284 | 7.469 | 11.877 | 16.855 | 38.923 | 20.295 | 4.987 | 8.352 | 9.482 | 13.170 | 18.498 | 14.589 | 10.287 | 5.275 | 4.648 | 4.858 | 0.199 | 3.567 | 4.719 | 6.334 | 3.036 | 6.300 | 5.996 | 1.184 | 0.700 | 2.838 | 2.386 | 7.711 | -1.269 | 1.560 | 2.436 | 2.801 | 0.169 | 1.577 | 1.428 | 6.065 | 7.308 | 4.034 | 8.108 | 3.645 | 5.824 | 9.430 | 4.530 | 1.810 | 1.770 | -1.110 | 1.280 | 4.410 | 3.69 | 4.100 | 2.882 | 3.064 | 9.439 | Annual average inflation |
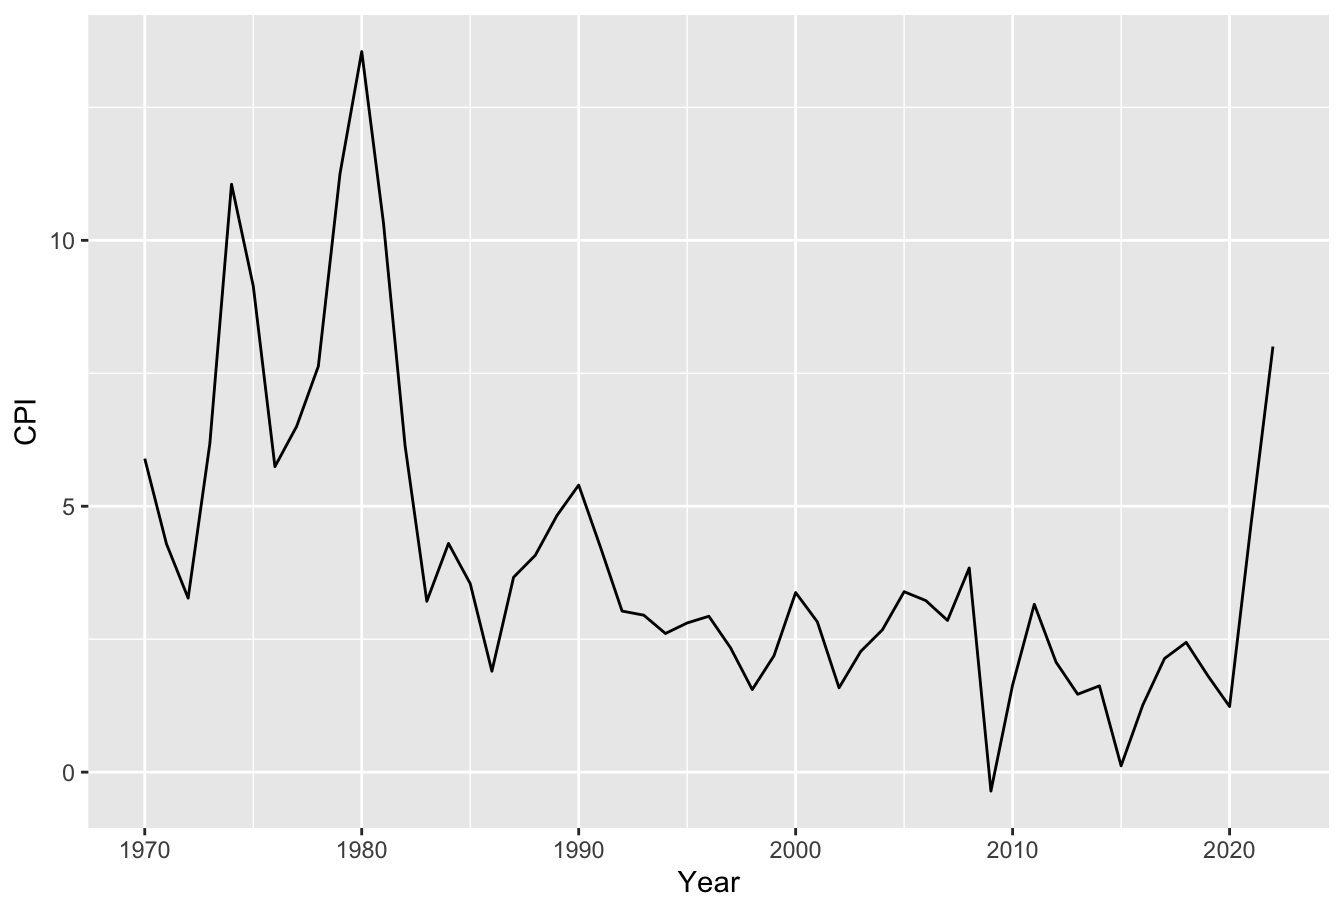
Example: World Bank Inflation Data
How do we create a line plot with Year on the x-axis and CPI on the y-axis for the US?
| Country | Year | CPI |
|---|---|---|
| Aruba | 1970 | NA |
| Aruba | 1971 | NA |
| Aruba | 1972 | NA |
| Aruba | 1973 | NA |
| Aruba | 1974 | NA |
| Aruba | 1975 | NA |
| Aruba | 1976 | NA |
| Aruba | 1977 | NA |
| Aruba | 1978 | NA |
| Aruba | 1979 | NA |
| Aruba | 1980 | NA |
| Aruba | 1981 | NA |
| Aruba | 1982 | NA |
| Aruba | 1983 | NA |
| Aruba | 1984 | NA |
| Aruba | 1985 | NA |
| Aruba | 1986 | NA |
| Aruba | 1987 | NA |
| Aruba | 1988 | NA |
| Aruba | 1989 | NA |
| Aruba | 1990 | NA |
| Aruba | 1991 | NA |
| Aruba | 1992 | NA |
| Aruba | 1993 | NA |
| Aruba | 1994 | NA |
| Aruba | 1995 | NA |
| Aruba | 1996 | 3.200 |
| Aruba | 1997 | 2.996 |
| Aruba | 1998 | 1.875 |
| Aruba | 1999 | 2.277 |
Example: World Bank Inflation Data
Data manipulation cheatsheet
filter()subset rowsselect()subset columns, use withcontains(),starts_with(),ends_with(), …mutate()create columnsgroup_by(),summarize(),count()group and summarize groupsrename()rename columnspivot_longer(),pivot_wider()reshape datainner_join(),left_join(),right_join(),outer_join()combine data (like SQL)
Exploratory data analysis
Exploratory data analysis is the process of learning about a dataset by visualizing, summarizing, and transforming it.
By now we’ve seen most of the skills you need to carry out exploratory data analysis (EDA). As Wickham, Çetinkaya-Rundel, and Grolemund put it, the cycle of EDA looks something like this:
Generate questions about your data.
Explore your questions by visualizing, transforming, and modelling your data.
Use your findings to refine your questions and generate new questions.
You can read their walkthrough of the EDA process here.